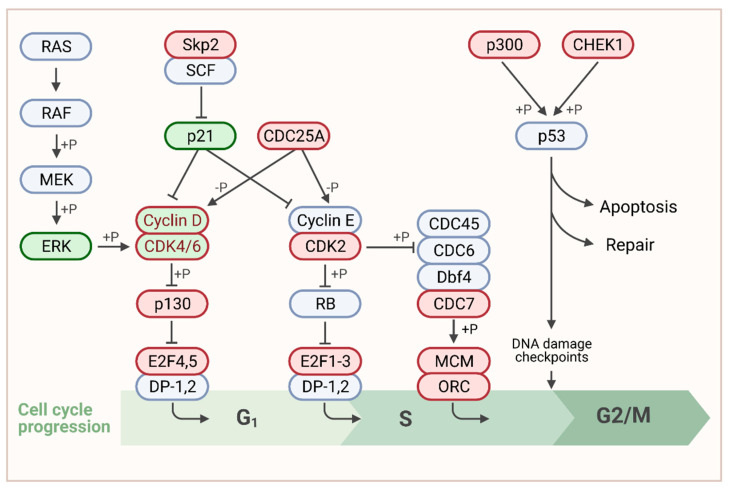
Figure 3.
Association of MSI1 expression with cell cycle related genes. Schematic representation of the G1/S focus part of the KEGG: cell_cycle pathway according to (https://www.genome.jp/, accessed on 30 March 2021). For the entire pathway please refer to Supplementary Materials, Figure S1. Published MSI1 target transcripts are depicted in green. Genes that were positively correlated to MSI1 in more than 50% of cancer entities are shown in red. Genes that belong to both categories are shown in dual color. Created with www.BioRender.com, accessed on 31 March 2021.

