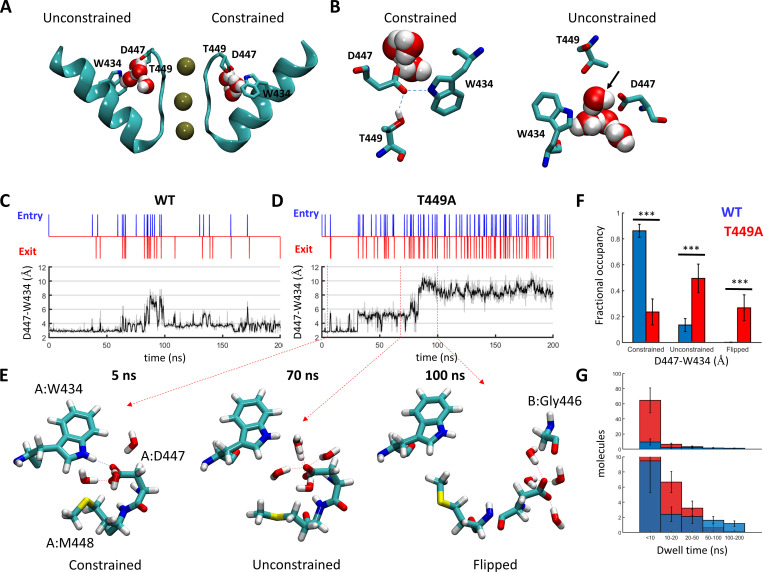
Figure 10.
Regulation of water exchange in the peripheral pockets of Shaker by the amino acid at position 449. (A and B) Snapshot of the Shaker channel depicting the peripheral water pockets at open and closed states. (A) Side view of a cross section through the channel pore region depicting the selectivity filter and the pore helix of two opposing subunits. Bound K+ ions and structural water molecules behind the selectivity filter are depicted. Upper-barrier gate residues are indicated. (B) Top views of the peripheral pockets depicted in A. Dashed lines indicate hydrogen bonds; a water molecule passing through an open gate is marked by an arrow. (C and D) Time-series plots depicting water-exchange events (top) versus D447:W434 gate openings (bottom) during a 200-ns MD time series of WT Shaker (left) versus the T449A mutant (right). Unsmoothed data are represented as a gray shade of the smoothed trace. (E) Snapshots along a time series of Shaker T449A, depicting the spatial disposition of the upper-barrier residues of channel subunit A in a constrained (5 ns), unconstrained (70 ns), and flipped (100 ns) conformations. Water molecules within a hydrogen-bond distance from D447 are shown. (F) Dwell-time distributions of the D447:W434 gate at the constrained/unconstrained/flipped conformations averaged over six independent trajectories of WT Shaker (Table S1; trajectories 1–6, blue) or Shaker T449A (trajectories 7–12, red). Statistical significance was determined using the Wilcoxon rank sum test. (G) Dwell-time distributions of water molecules within the peripheral pockets compared between the WT (blue) and T449A (red) runs. The top panel displays the total numbers of molecules counted at the indicated bins averaged over the six runs (blue, WT; red, T449A). The lower panel is a zoomed-in version of the top panel. The bias of the T449A distribution toward shorter dwell times was statistically significant (two-sample Kolmogorov–Smirnov test, P = 0.03).

