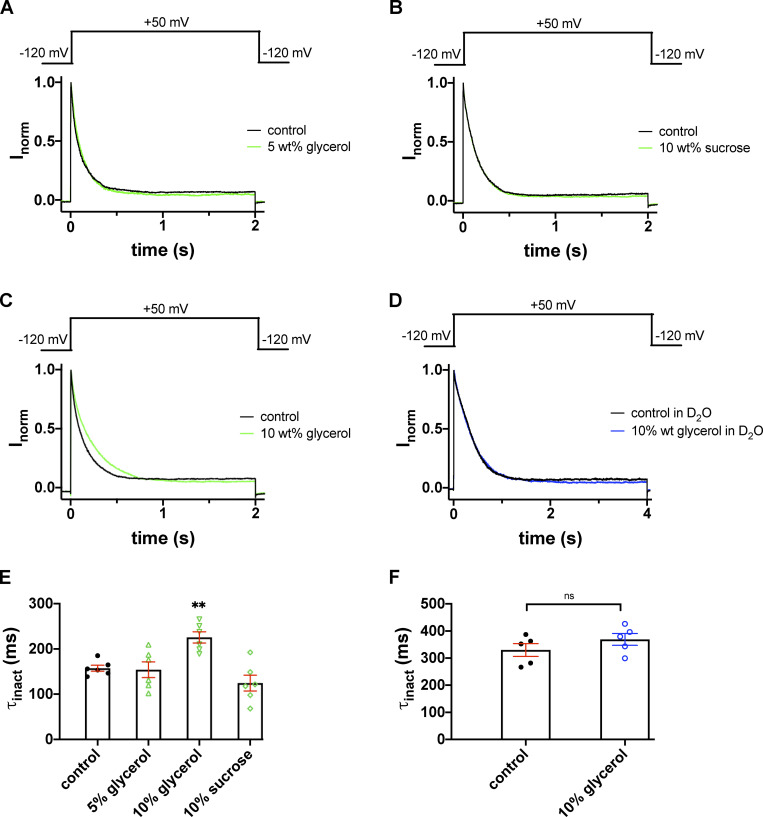
Figure 7.
Inactivation kinetics of the T449A Shaker-IR current in glycerol- and sucrose-supplemented extracellular solutions. (A–C) K+ currents were recorded in outside-out patch configuration with repeated 2.0-s depolarizations from a holding potential of −120 mV to +50 mV. Test pulses were applied every 45 s. During the first depolarizing pulse the patches were perfused with standard extracellular bath solutions (solid black lines). The second depolarizing pulse was applied in the presence of 5 wt% glycerol (A), 10 wt% sucrose (B), and 10 wt% glycerol (C), respectively (solid green lines). The traces recorded after washout are omitted for clarity. (D) The time course of inactivation of outside-out patch currents was determined in an extracellular bath solution prepared in D2O (solid black line) and a solution with 10 wt% glycerol dissolved in the D2O-based external solution (solid blue line). (E and F) Inactivation time constants (τinact) at +50 mV were determined by fitting a single-exponential function to the decaying parts of the current traces and averaged for n = 5–6 cells. (E) Bars and error bars indicate the mean ± SEM of τinact values, symbols indicate individual data points obtained in H2O-based extracellular solution (H2O//H2O) in the control condition (filled circles, no glycerol or sucrose supplementation) or the glycerol- or sucrose-supplemented, H2O-based extracellular solution (as indicated, empty green symbols; up triangles, 5 wt% glycerol; down triangles, 10 wt% glycerol; diamonds, 10 wt% sucrose). (F) The same data representation as in E, except that data are from D2O-based extracellular solution (H2O//D2O) in the control condition (filled circles, no glycerol supplementation) or the 10% glycerol-supplemented, D2O-based extracellular solution (open blue circles). Asterisks indicate a statistically significant difference (**, P < 0.01).

