. 2019 Dec 18;11(6):1617–1622. doi: 10.1039/c9sc05505c

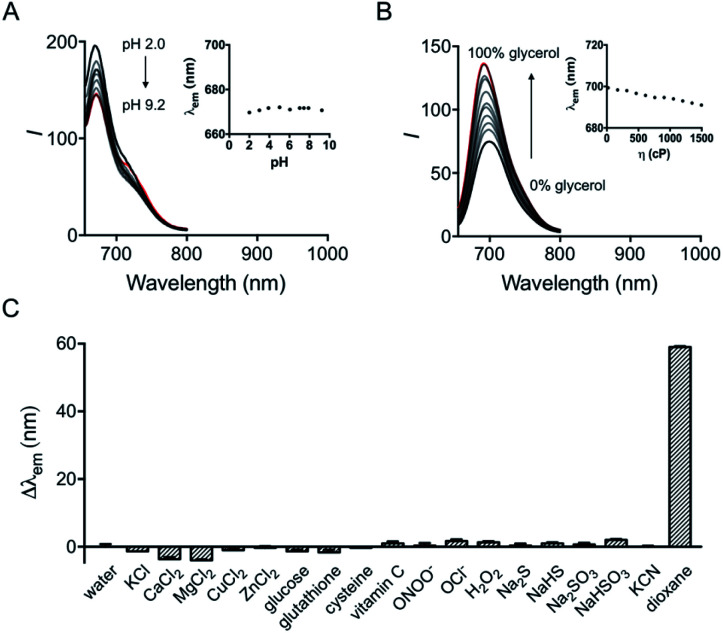
Fig. 3. (A) Fluorescence emission spectra of HXPI-P (10 μM) in phosphate buffer (20 mM) at different pH values. Inset: the plot of λemvs. pH in the range of pH 2.0 to pH 9.2. (B) Fluorescence emission spectra of HXPI-P (10 μM) in the mixture of glycol and glycerol. Inset: the plot of λemvs. viscosity in the range of η = 22.1 cP to η = 1495 cP. The percentage indicates the volume fraction. (C) Fluorescence responses of HXPI-P (10 μM) to various substances: water, KCl (150 mM), CaCl2 (2.0 mM), MgCl2 (2.0 mM), CuCl2 (100 μM), ZnCl2 (100 μM), glucose (10 mM), glutathione (1.0 mM), cysteine (100 μM), vitamin C (1.0 mM), ONOO (100 μM), OCl (100 μM), H2O2 (100 μM), Na2S (100 μM), NaHS (100 μM), Na2SO3 (100 μM), NaHSO3 (100 μM), KCN (100 μM) and 1,4-dioxane. λex = 635 nm. Δλem = λem (in an examed solution) − λem (in water). Data are expressed as the mean ± SD of three separate measurements.

Fig. 3