. 2019 Dec 18;11(6):1617–1622. doi: 10.1039/c9sc05505c

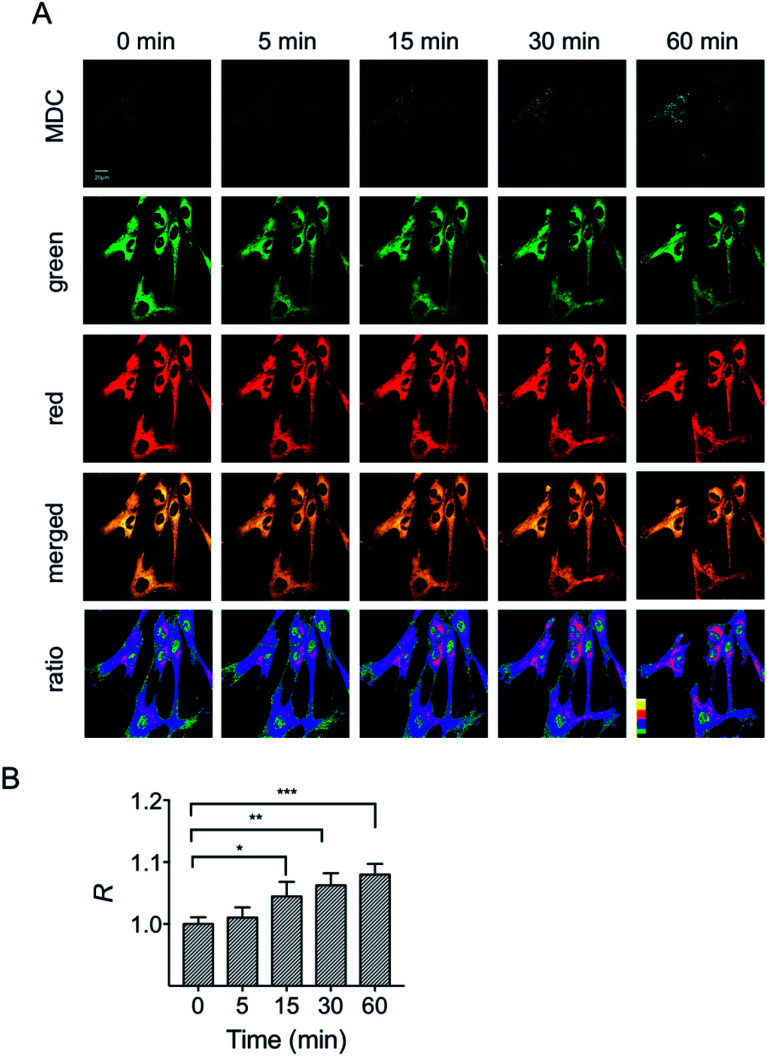
Fig. 7. Confocal fluorescence images of HFL-1 cells incubated with HXPI-P (5.0 μM), MDC (1.0 μM) and rapamycin (50 nM). (A) Images in the MDC (λem = 450–550 nm) channel was collected at λex = 405 nm; images in the green (λem = 655–685 nm) and red (λem = 700–730 nm) channels were collected at λex = 635 nm. The images in the fourth row are the merged ones of red and green channels. The fifth row shows the corresponding ratiometric images between red and green channels. Scale bar = 20 μm. (B) Polarity changes of mitochondria with time. The fluorescence intensity ratio at 0 min is defined as 1.0. The data are expressed as the mean ± SD of three measurements. Significant differences (*p < 0.05, **p < 0.01, ***p < 0.001) are obtained by Student's t-test.

Fig. 7