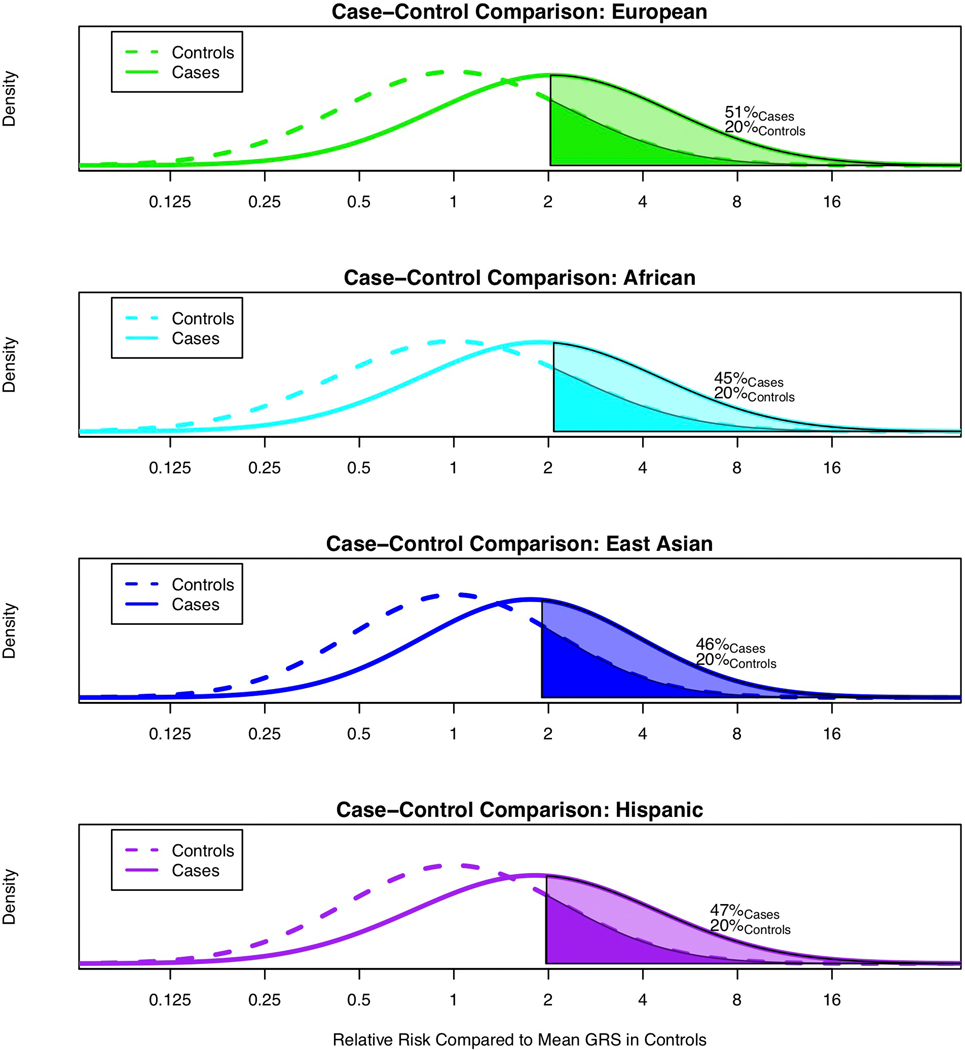
Extended Data Fig. 7. Comparison of the GRS distributions between cases and controls.
A) Men of European ancestry and B) Men of African Ancestry; C) Men of Asian ancestry; and D) Hispanic men. The x-axis indicates the relative risk calculated by exponentiation of the difference in the mean genetic risk score (GRS) in controls and the mean GRS in cases for each population. The y-axis indicates the GRS density. Solid areas and corresponding percentages are the proportion of cases and controls with a GRS above 20% in the controls.

