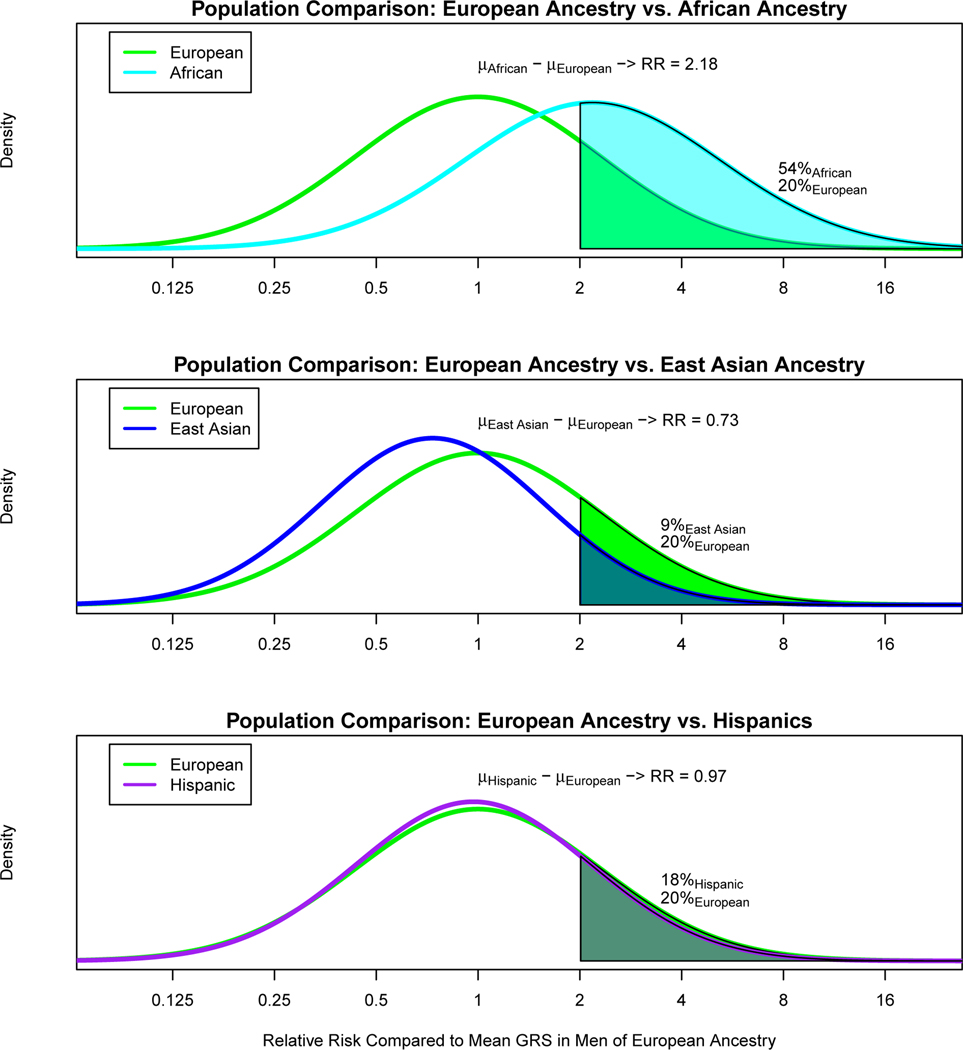
Figure 2.
Comparison of prostate cancer GRS distributions for controls. A. Men of European ancestry versus men of African ancestry; B. Men of European ancestry versus men of East Asian ancestry; and C. Men of European ancestry versus Hispanic men. The x-axis indicates the relative risk calculated by exponentiation of the difference in the mean GRS in controls for men of European ancestry and the mean GRS in controls for each of the other populations. The y-axis indicates the GRS density. Solid areas and corresponding percentages indicate the proportion of a given population with a relative risk greater than or equal to 2.0 in comparison to the mean GRS for men of European ancestry.

