. 2019 Dec 18;11(5):1368–1374. doi: 10.1039/c9sc05558d

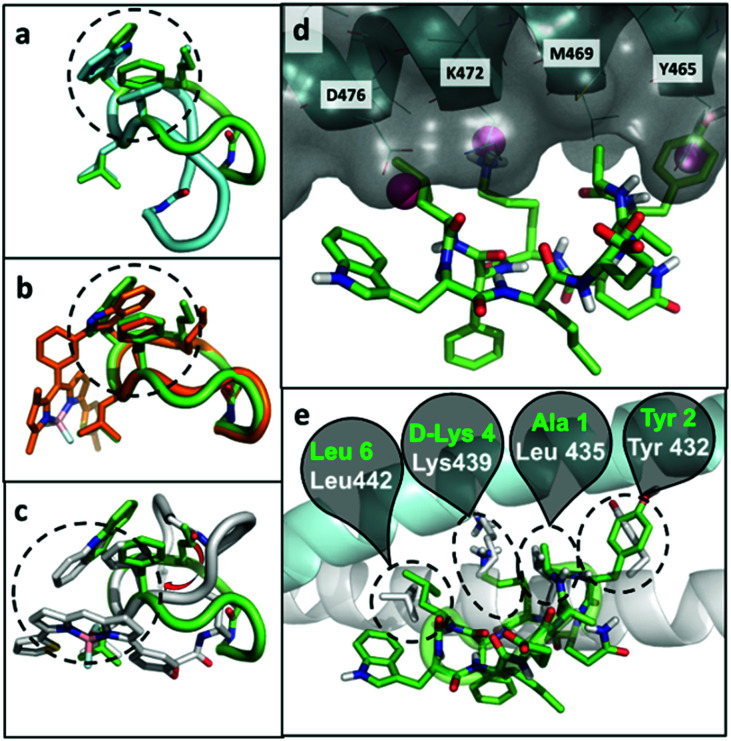
Fig. 3. Representative conformations of unlabelled peptide 2 (green), overlapped to: (a) the second most populated conformation of 2 (cyan); (b) the most representative conformation of peptide 8 (orange); and (c) the most representative conformation of peptide 9 (grey). The dashed circles highlight the hydrophobic core on each structure. (d) Putative binding mode of peptide 2 (green) bound to KRT1 (grey surface with cyan cartoon). Some contact residues are labelled for reference. The pink spheres indicate binding hot spots identified with MDmix. (e) Overlap with the experimental binding mode of KRT10 (grey cartoon and sticks), indicating the residues of the peptide 2 (green) and protein (white) that coincide. In this cartoon, KRT1 is shown in cyan.

Fig. 3