. 2019 Dec 18;11(5):1368–1374. doi: 10.1039/c9sc05558d

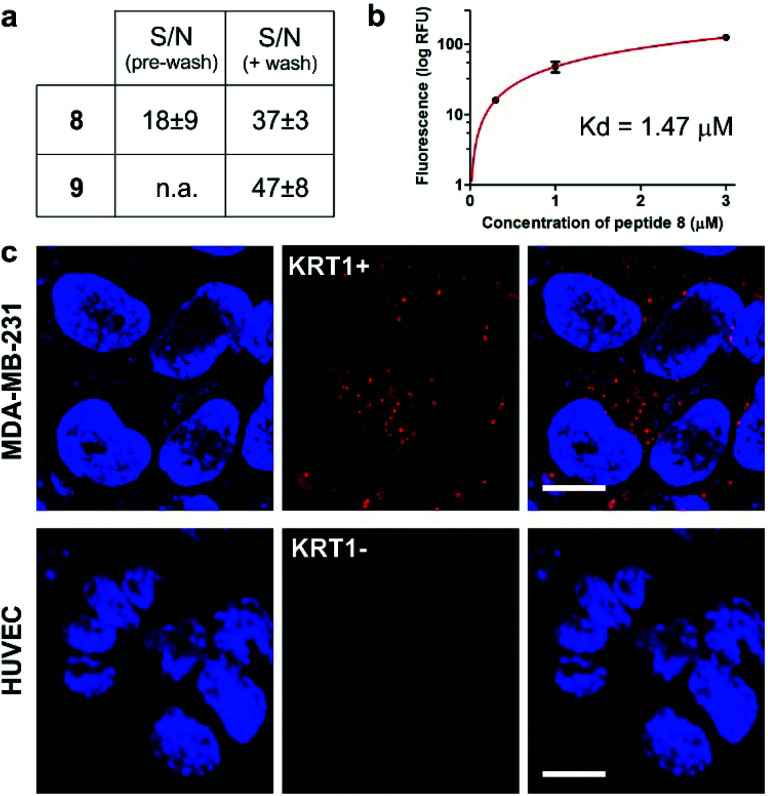
Fig. 4. (a) Quantification of the signal-to-noise (S/N) ratios for peptides 8 and 9 in MDA-MB-231 cells before and after washing (fluorescence microscope images in Fig. S14). Values are presented as means ± s.e.m. (n = 3). (b) Flow cytometric analysis of MDA-MB-231 (KRT1+ cells) upon incubation with increasing concentrations of the Trp(redBODIPY)-labelled peptide 8 (R2: 0.990). Values are presented as means ± s.d. (n = 3). (c) Fluorescence microscope images of cells expressing different levels of KRT1 (MDA-MB-231 as KRT1-positive, HUVEC as KRT1-negative cells) upon incubation with the peptide 8 (red, 1 μM) and Hoechst 33342 for nuclear counterstaining (blue). Scale bar: 10 μm.

Fig. 4