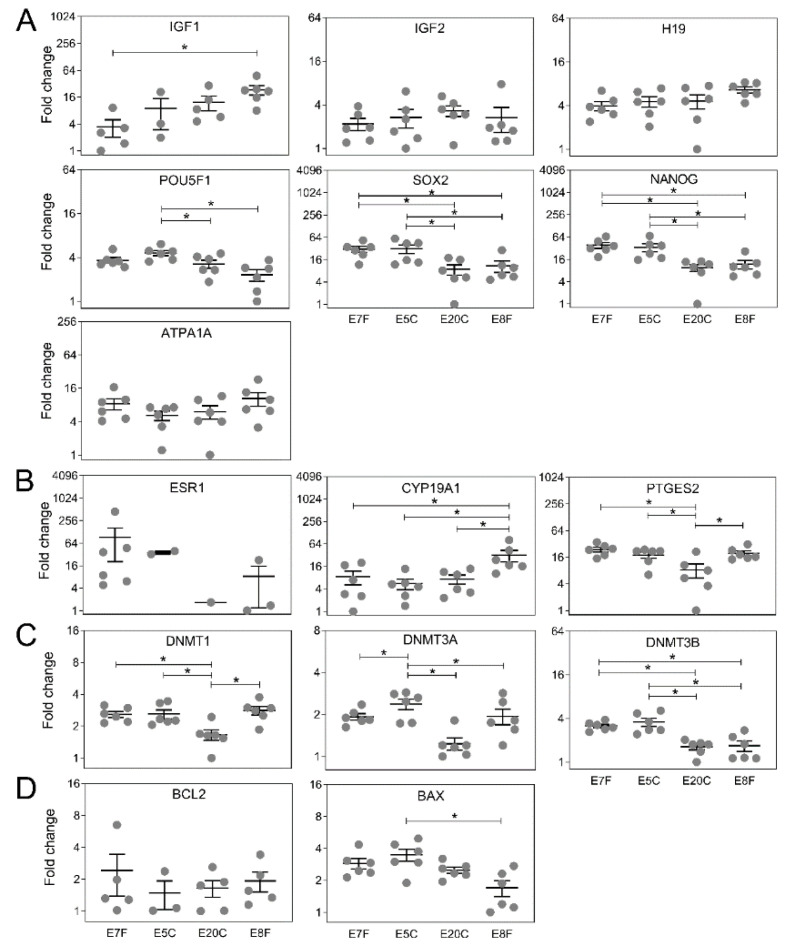
Figure 3.
Relative mRNA expression levels of genes related to: (A) growth and development, (B) embryo-maternal communication, (C) methylation, and (D) apoptosis in fresh control (E7F and E8F) and stored embryos (E5C and E20C). E5C and E20C either did not express ESR1 or did not have enough samples; therefore, values were not considered for statistical comparison. Each dot represents a single embryo. The plot represents the descriptive variation (mean ± S.E.M., n = 6) within the group. Fold-changes were calculated with the comparative 2−ΔΔCT method (* p < 0.05).

