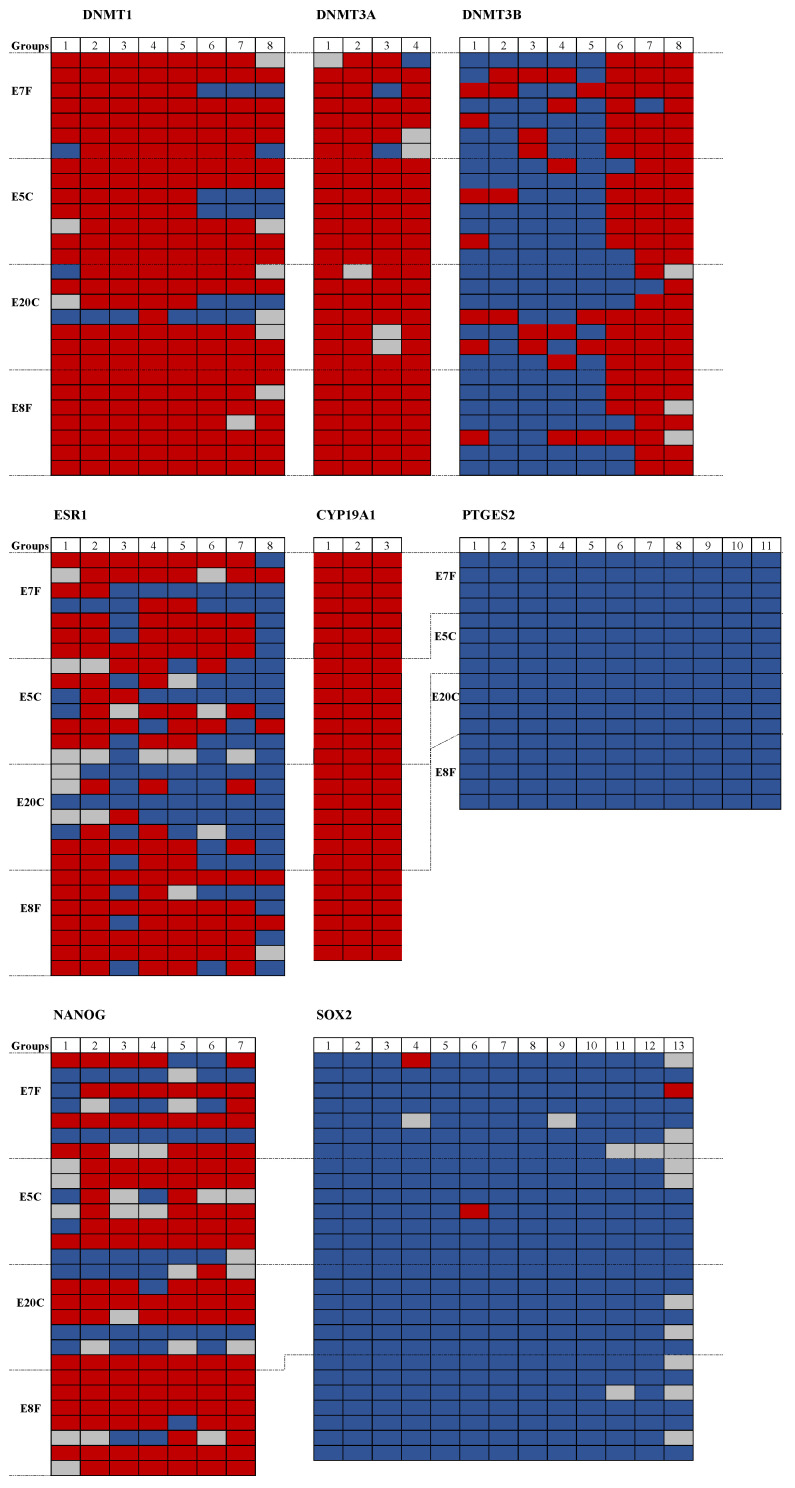
Figure 4.
Overview of DNA methylation results of single CpGs for the selected genes. DNA methylation (DNMT1, DNMT3A, DNMT3B), embryo-maternal recognition (ESR1, CYP19A1, PTGES2), and growth and development (NANOG, SOX2) of the equine embryo. Blue box, unmethylated CpG; red box, methylated CpG; gray box, unclear methylation state. One row refers to one embryo and the number of columns refers to the number of CpGs sequenced in the CG-rich region (methprimer CpG island finder) upstream of the gene (Table 2).

