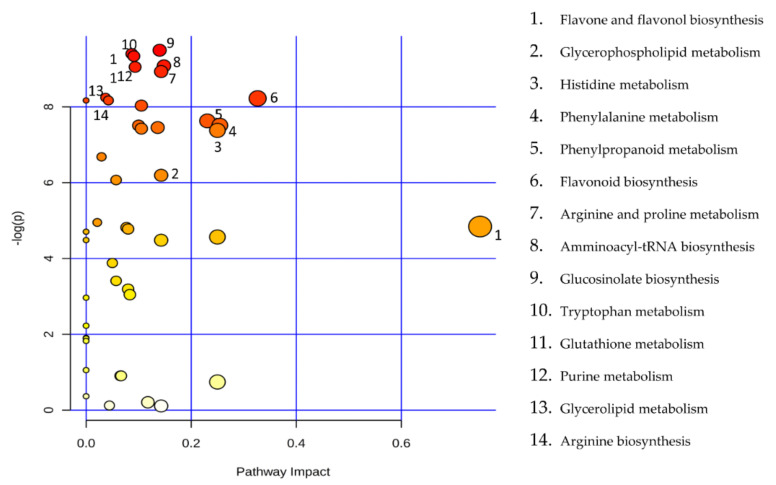
Figure 2.
Metabolic Pathway Analysis (MetPA). All the matched pathways are displayed as circles. The colour and size of each circle are based on the p-value and pathway impact value, respectively. The graph was obtained by plotting the −log of p values from the pathway enrichment analysis on the y-axis and the pathway impact values derived from the pathway topology analysis on the x-axis.

