Figure 2.
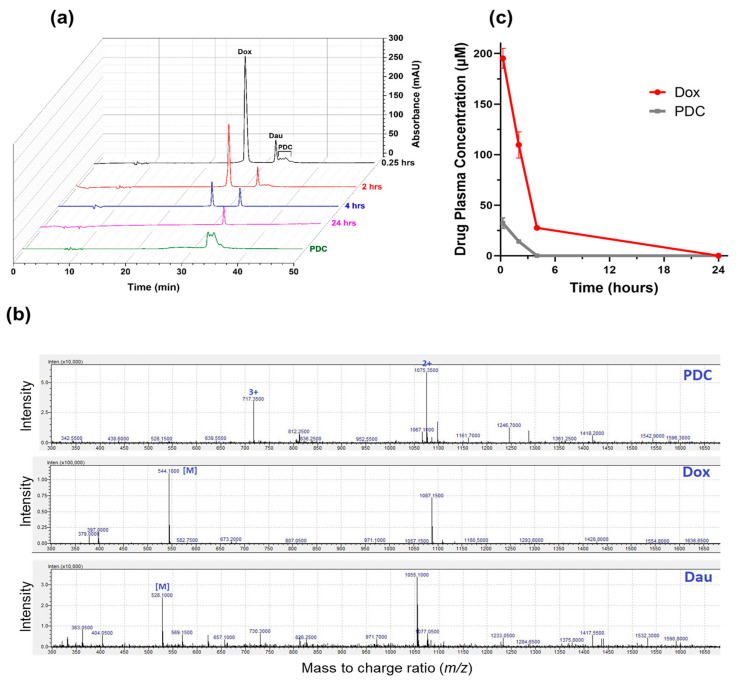
Concentration of total drug (PDC and Dox) after administration of PDC in female (8-week-old) nonobese diabetic—severe combined immunodeficiency (NOD-SCID) mice. Mice (n = 3) were administrated PDC (2.5 mg/kg Dox equivalent or 0.088 ± 0.008 µmoles) via tail vein injection, and blood was collected via cardiac puncture at 0.25, 2, 4, and 24 h. The serum (100 µL) from blood was collected. Serum was subjected to organic extraction, and the extract was injected in LC/MS system to detect and quantify PDC and released Dox. No other metabolites of Dox were observed. (a) Representative chromatograms for samples after extraction, monitored at λ = 481 nm. Dau was used as an internal standard. Chromatogram of pure PDC (280 µM, 20 µL) is shown for comparison; (b) Representative electrospray ionization (ESI) mass spectra of PDC, Dox, and Dau obtained during the LC/MS analysis of one sample out of three at 0.25 min. PDC shows two m/z peaks at 717.35 and 1075.35 with charges +3 and +2, respectively. The found mass (M) from these peaks for PDC was 2149.1 (calcd. 2148.7). For Dox and Dau, the found mass were 544.1 (calcd. 543.5) and 528.1 (calcd. 527.5), respectively; (c) Average serum concentration (µM) of PDC and Dox at each time interval obtained from the LC/MS data. Data shown is mean ± SD.

