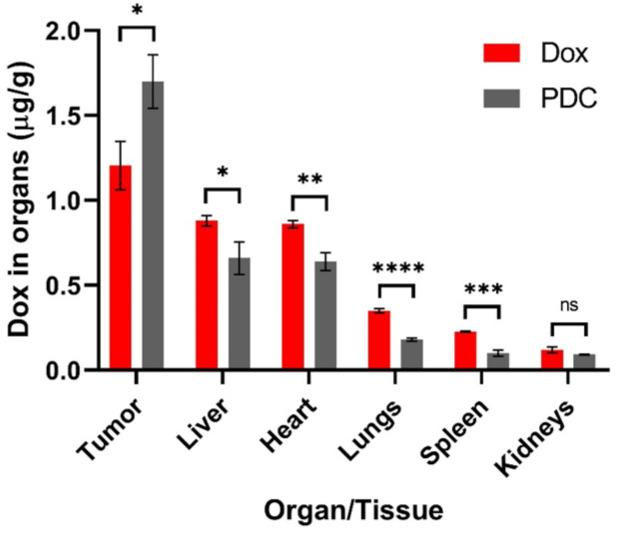
Figure 5.
Biodistribution of Dox in tumor and other tissues at 24 h post injection (Dox or PDC). Data are presented as mean ± SD; n = 3; * p < 0.05, ** p < 0.01, *** p < 0.001, **** p < 0.0001, ns non-significant; Student t-test and one-way ANOVA were used. The significance level (α) was set at 0.05.

