Figure 1.
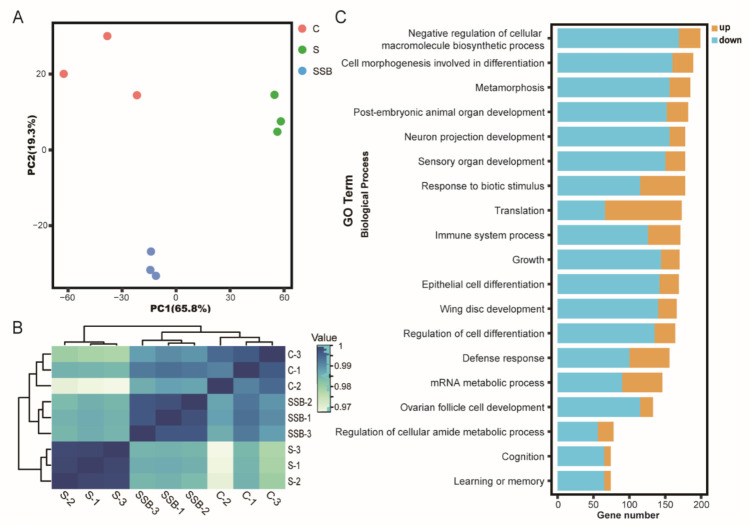
RNA sequencing analysis of conventional Drosophila (C), sterile Drosophila (S) and sterile Drosophila treated with sodium butyrate (SSB). (A) Principal component analysis of RNA sequencing data from three groups, n = 3. (B) Pearson correlation heat map of RNA sequencing data from three groups, white to blue, indicates an increase in correlation. (C) Gene ontology enrichment of RNA sequencing data from sterile Drosophila compared to sterile Drosophila treated with sodium butyrate. The x-axis represents gene numbers upregulated or downregulated, and the y-axis represents different pathways in biological process.

