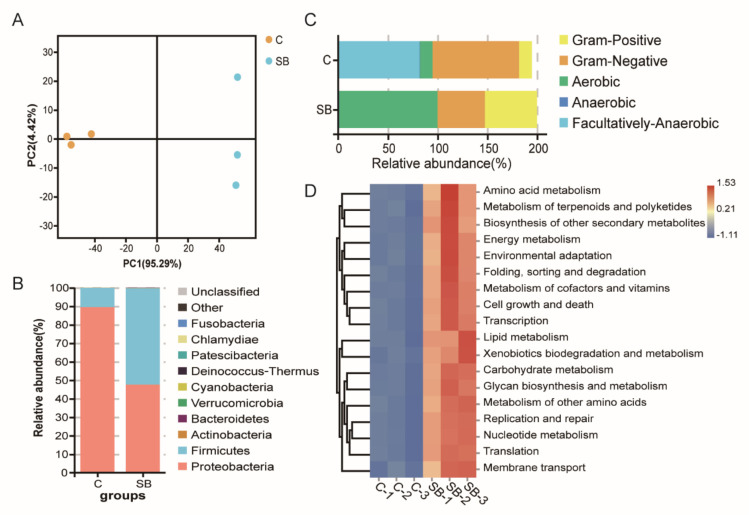
Figure 3.
Gut microbiome analysis of 16S rDNA sequencing data from conventional Drosophila (C) and sodium butyrate-treated Drosophila (SB). (A) Principal component analysis of samples from two groups, n = 3. (B) Microbiome analysis shown at phylum level. (C) Organism level microbiome phenotypes predicted with Bugbase. (D) Functional prediction heat map with PICRUSt.

