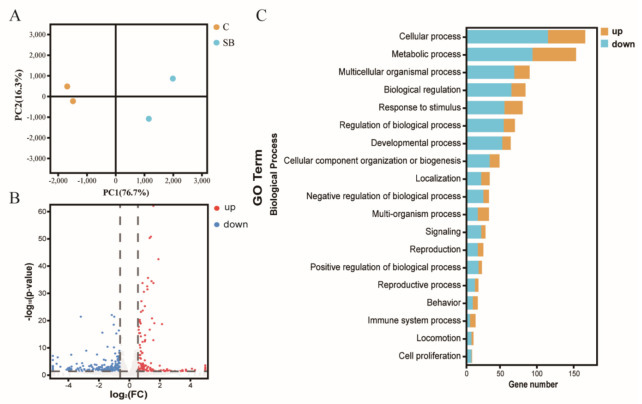
Figure 4.
RNA sequencing analysis of conventional Drosophila (C) and sodium butyrate-treated Drosophila (SB). (A) Principal component analysis of samples from two groups, n = 2. (B) Volcano plot showing transcriptional regulation of genes. (C) Gene ontology enrichment of RNA sequencing data from conventional Drosophila compared to sodium butyrate-treated Drosophila. The x-axis represents gene numbers upregulated or downregulated, and the y-axis represents different pathways in the biological process.

