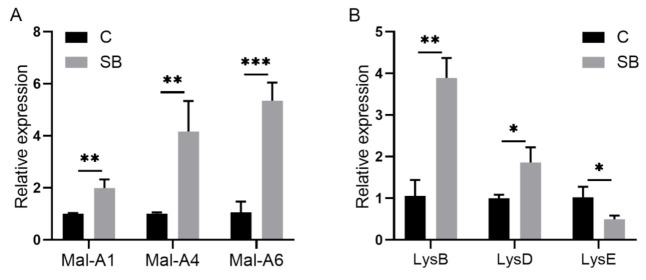
Figure 5.
Quantitative RT-PCR validation of genes from conventional Drosophila (C) and sodium butyrate-treated Drosophila (SB). (A) Relative expression of transcripts encoding metabolic enzymes in qRT-PCR experiments. (B) Relative expression of transcripts encoding lysozyme family proteins in qRT-PCR experiments. Significant differences are determined by the unpaired Student’s t-test. * p < 0.05, ** p < 0.01, *** p < 0.001.

