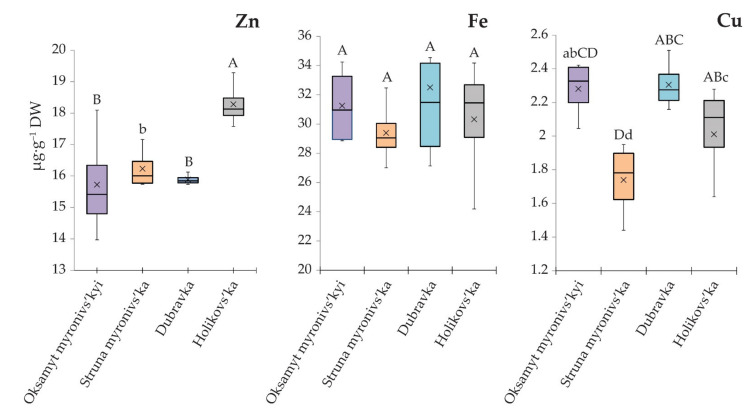
Figure 2.
Grain Zn, Fe, and Cu concentrations (µg∙g−1 DW) at the stage of grain ripening. Wheat varieties were grown in the field with soil type Chernozem on eluvium of carbonate rock, pH 7.15, Dmytriv location (50°13′26.6″ N, 24°36′50.5″ E), in the Y2017 crop season. Statistically significant differences in the accumulation of individual elements were identified using Tukey’s test of one-way ANOVA. Levels not connected by the same letter are significantly different (capital letters indicate p < 0.05; lower case letters indicate p < 0.1).

