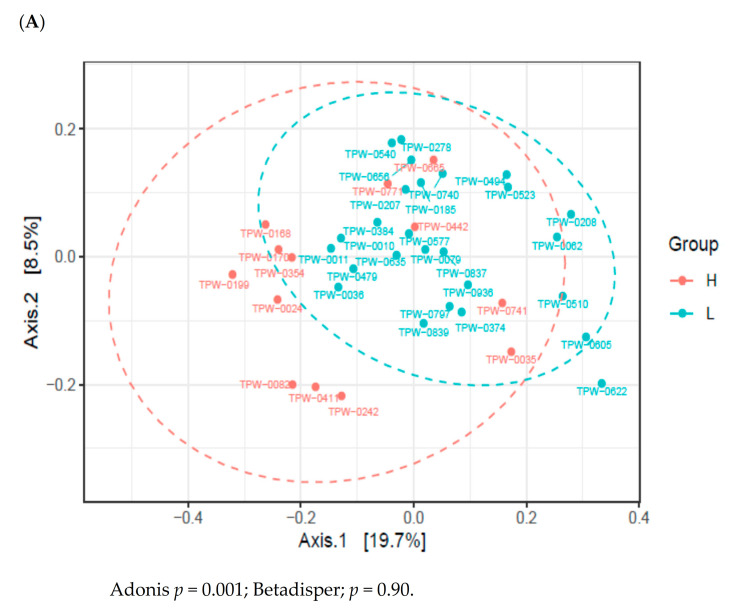
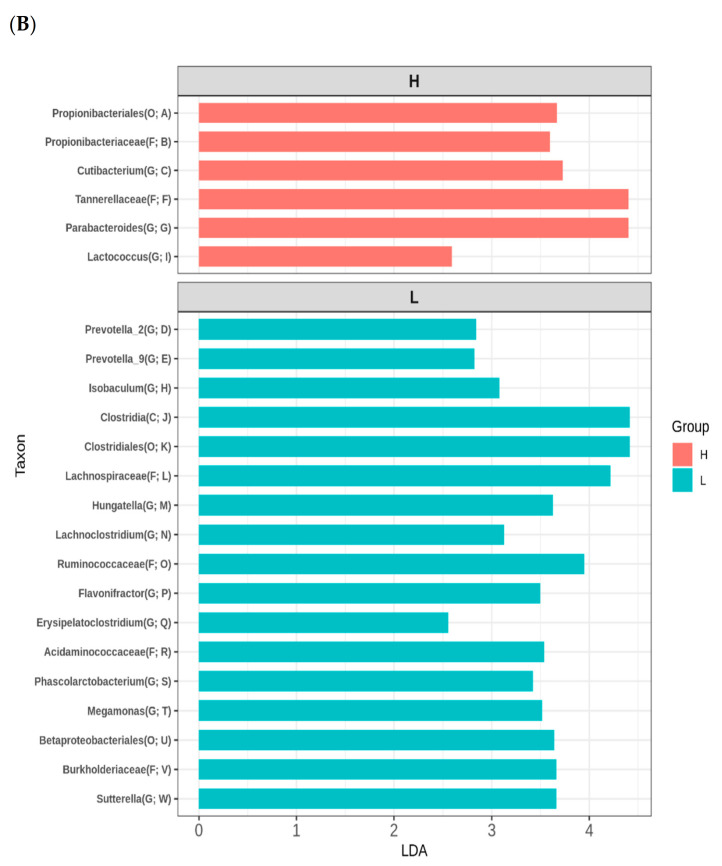
Figure 2.
Variations in the infant gut microbiome at 2 months of age according to maternal fruit and vegetable consumption during pregnancy. (A) Principal coordinates analysis (PCoA) on unweighted unique fraction (UniFrac). (B) linear discriminant analysis effect size (LEfSe). The ordination is from A to W in a tree diagram (Figure S3). Definition of abbreviation: H, high maternal consumption of fruits and vegetables during pregnancy; L, low maternal consumption of fruits and vegetables during pregnancy; O, order; F, family; G, genus.


