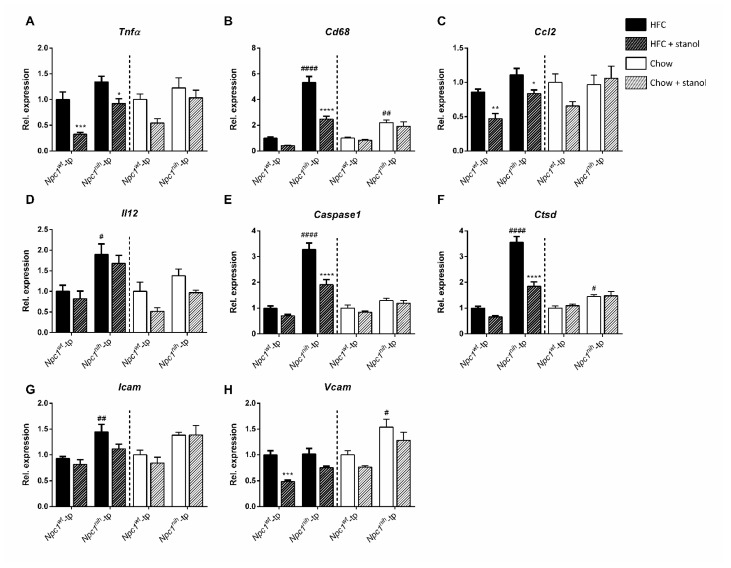
Figure 6.
Hepatic inflammation-related gene expression: HFC and chow diets. Hepatic gene expression of inflammatory markers (A) Tnf-α, (B) Cd68, (C) Ccl2, (D) Il12, (E) Caspase1, (F) Ctsd, (G) Icam and (H) Vcam. n = 6–8 mice per group for gene expression analyses. All error bars represent standard error of the mean. Statistical significance is indicated as follows: Npc1nih-tp mice on a HFC or chow diet vs. Npc1wt-tp mice on a HFC or chow diet (# p ≤ 0.05; ## p < 0.01; #### p < 0.0001); Npc1wt-tp or Npc1nih-tp on a HFC or chow diet vs. Npc1wt-tp or Npc1nih-tp mice on a plant stanol-enriched HFC or chow diet (* p ≤ 0.05; ** p < 0.01; *** p < 0.001; **** p < 0.0001).

