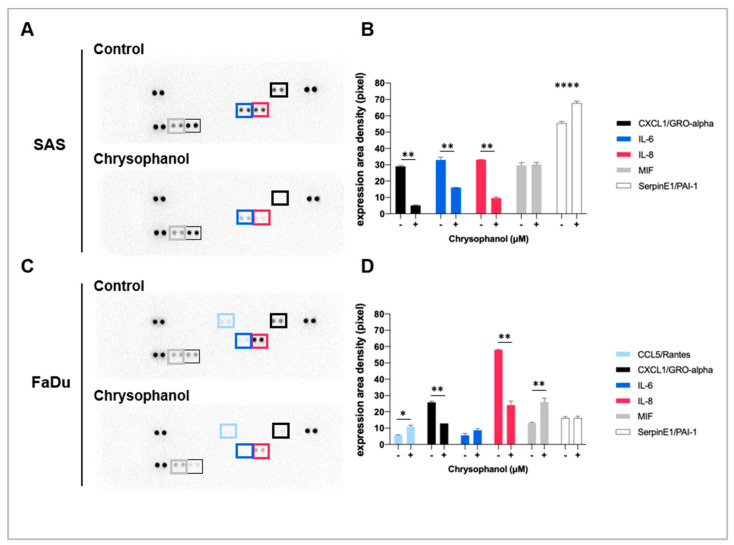
Figure 1.
The effects of chrysophanol on inflammatory cytokines in SAS and FaDu cell lines. (A) The panel shows an image of the signal spots on the membrane for each cytokine. Each spot represents one cytokine, and each cytokine is spotted in duplicate. Spots that show significant changes are marked in the SAS and FaDu cell lines. (B) The image of the spots was scanned and measured using NIH ImageJ software. The relative expression level of each protein was calculated from densitometry data from A and normalized to the control group (in the absence of chrysophanol). (C) The panel shows an image of the signal spots on the membrane for each cytokine. Each spot represents one cytokine and each cytokine is represented in duplicate. Spots that show significant changes are marked in the FaDu cell line. (D) The image of spots was scanned and measured using NIH ImageJ software. The relative expression level of each protein was calculated from densitometry data from C and normalized to the control group (in the absence of chrysophanol). Error bars indicate SD (n = 2). * p < 0.05. ** p < 0.01. **** p < 0.001.

