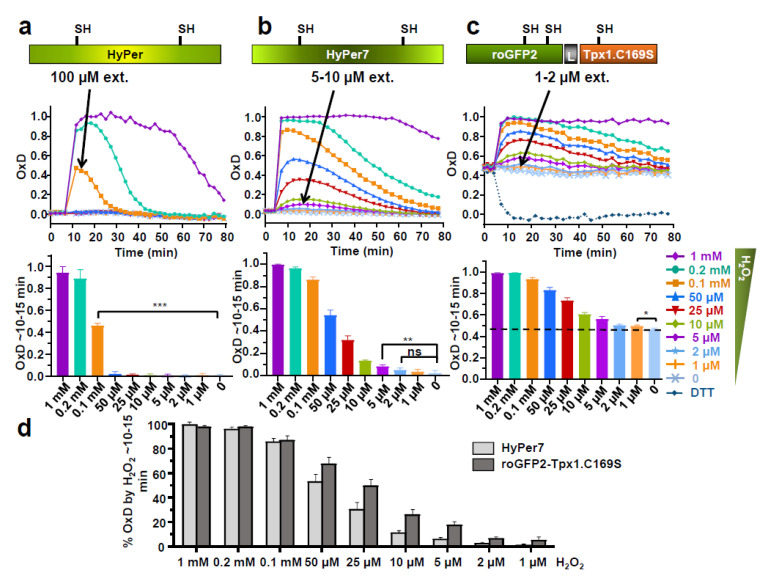
Figure 1.
Expression of HyPer (a), HyPer7 (b) and roGFP2-Tpx1.C169S (c) in fission yeast. Wild-type strain HM123. was transformed with plasmids p605, p728, and p407.C169S to express HyPer, HyPer7, and roGFP2-Tpx1.C169S, respectively. The indicated extracellular concentrations of H2O2 were directly added to MM cultures at an OD600 of 1 in 96-well imaging plates, and growth proceeded at 30 °C for the time indicated with shaking. The degree of probe oxidation (amount of probe oxidized per 1) is indicated in the Y-axis (OxD). The minimum concentrations of H2O2 capable of causing probe oxidation are indicated with arrows. For each strain, average data from three biological replicates are shown, with error bars (S.D.) displayed in Figure S1. Graph bars (bottom panels of a–c) represent the average OxD between 10 and 15 min for each treatment. Statistical significance was calculated between the indicated samples with an unpaired Student’s t-test with P-values of 0.05 (*), 0.01 (**), and 0.001 (***); ns, non-significant. (d) Percentage of oxidation of HyPer7 and roGFP2-Tpx1.C169S upon H2O2 treatments. Data from panels b and c are represented as the average of the percentage of oxidation between 10 and 15 min for each treatment, as described in Materials and Methods.

