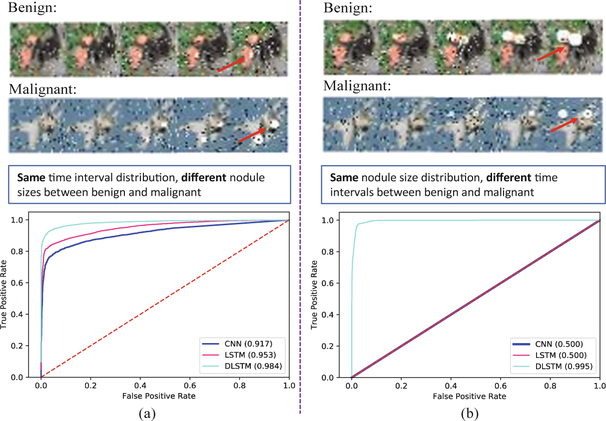
Fig. 2.
The receiver operating characteristic (ROC) curves of Tumor-CIFAR. The left panels simulate the situation that the images are sampled with the same interval distribution, while the right panels are sampled with the same size distribution. The upper panels show the examples of images in Tumor-CIFAR. The noise (white and black dots) are added, while the dummy nodules are shown as white blobs (some are indicated by red arrows). The lower panels show the Area Under the Curve of ROC (AUC) values of different methods.

