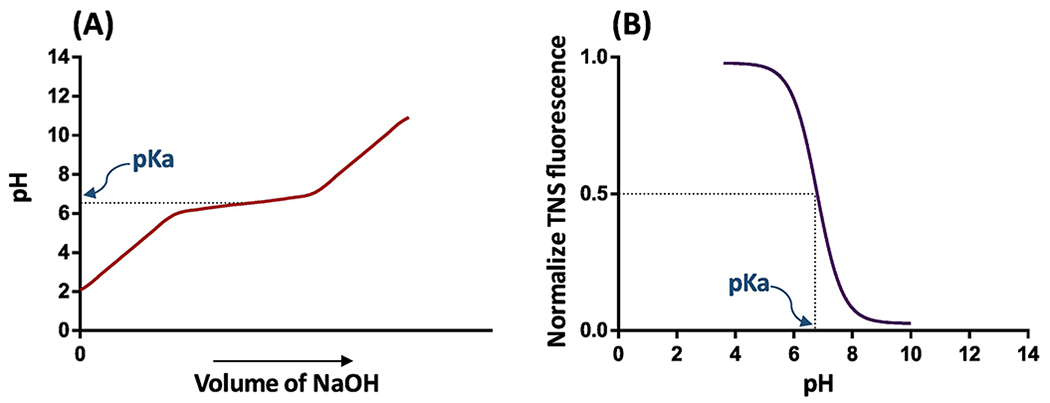
Figure I: Schematic diagram of the methods for pKa measurement:

A) Potentiometric titration of nanoparticles (in an acidic solution) with base to increase the pH. The deionization of the nanoparticles inflects the titration curve by producing buffer action. The middle of the two equivalence points represents the pKa of nanoparticles. B) TNS fluorescent measurement of nanoparticles at various pH shows the fluorescence corresponding to the ratio of ionized to deionized amines. TNS interacts with positively charged amines and produces fluorescence signal. The pH value at the half maximum value of fluorescence represents the pKa of nanoparticles.
