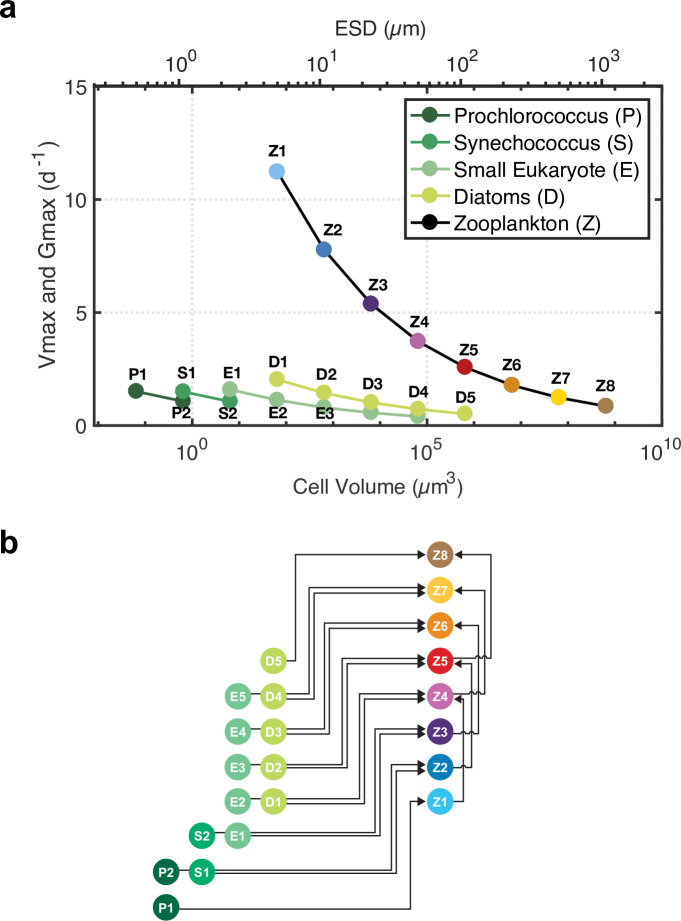
Fig 1.
(a) Maximum phytoplankton growth rates and maximum zooplankton grazing rates as a function of cell size (volume and equivalent spherical diameter, ESD) and taxon. (b) Schematic representation of the ecosystem model simplified to show only grazing and predation fluxes for clarity (for a complete representation of the model, see Fig 2 in Ward et al. (2012) [24]). Phytoplankton functional types (Prochlorococcus (P), Synechococcus (S), small Eukaryotes (E), Diatoms (D)) are divided into different size classes (P1, P2, S1, S2, etc.). Phytoplankton and zooplankton size classes (Z1, Z2, Z3, etc.) are represented with a color pallet used in subsequent figures.

