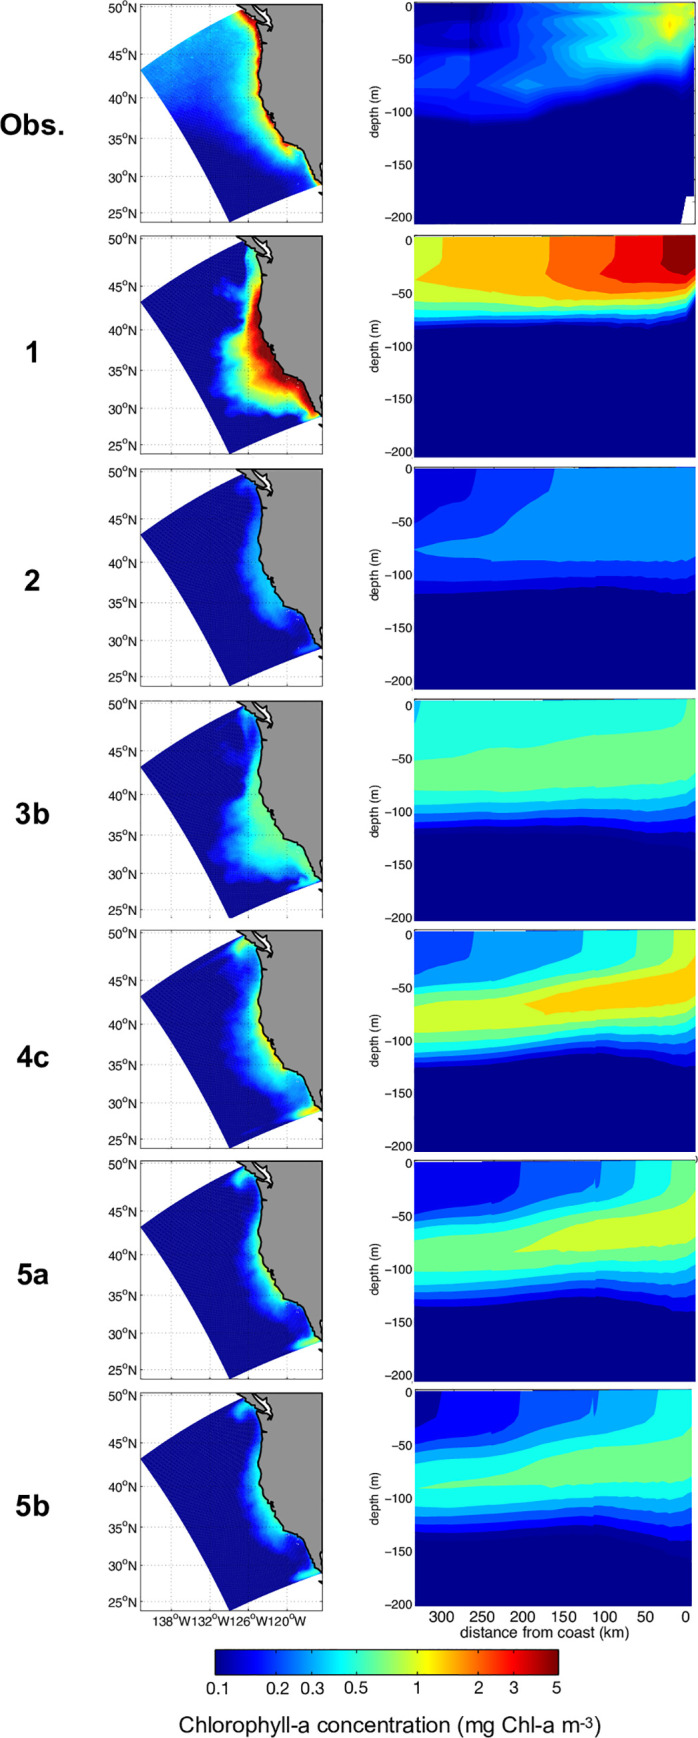
Fig 3.

(column 1) Annual mean surface chlorophyll-a concentration (mg Chl-a m-3); the top panel corresponds to observations from SeaWiFS, while other panels correspond to model outputs for grazing cases 1 to 5b. (column 2) Vertical sections of annual mean chlorophyll-a concentration across CalCOFI line 70 (mg Chl-a m-3); the top panel corresponds to observations from CalCOFI, while other panels correspond to model outputs at the same location for cases 1 to 5b.
