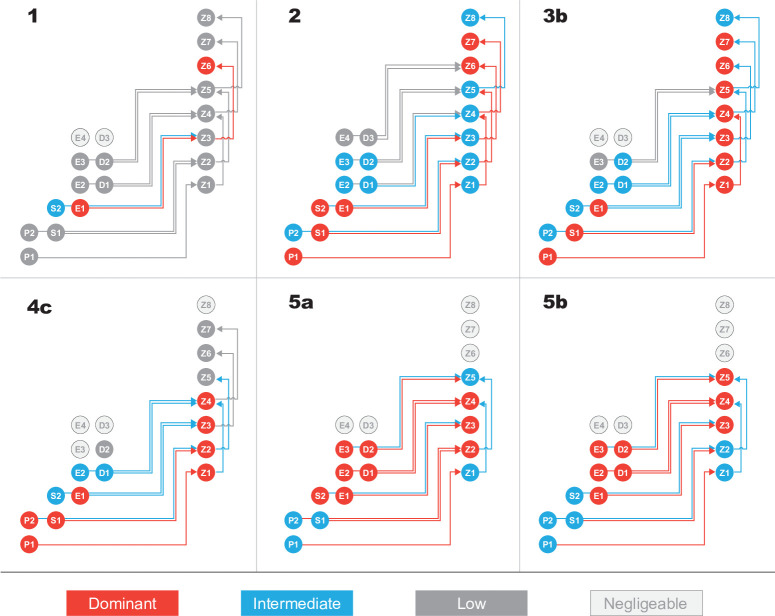
Fig 5. Simplified schematic representation of grazing and predation fluxes in the ecosystem model for grazing cases 1 to 5b.
For each case, biomasses (circles) and fluxes (arrows) are color-coded as follows: Dominant in red, intermediate in blue, and low in dark grey. Negligible fluxes are not shown, and negligible biomasses are represented in light grey. See S1 and S2 Tables for detailed biomasses and grazing fluxes, respectively.

