. 2019 Dec 27;11(7):1862–1877. doi: 10.1039/c9sc05103a

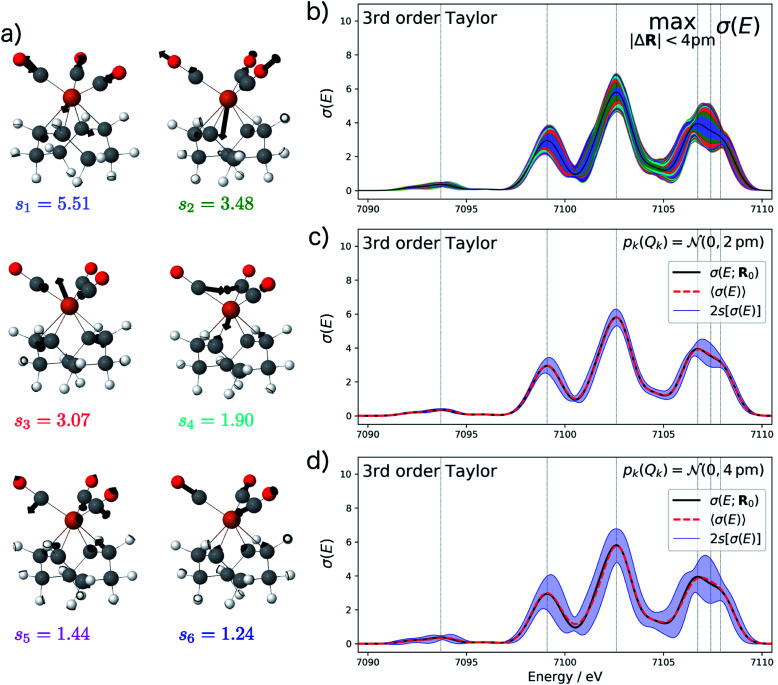
Fig. 5. Analysis of the structural sensitivity of the calculated XES spectrum of Fe(CO)3(cod). (a) Visualization of the six most influential sensitivity modes. (b) Calculated spectrum including error bars giving upper and lower bounds for distortions with |ΔR| ≤ 4 pm. The colors of the shaded area indicate the contributions of the different sensitivity modes. (c and d) Calculated spectrum including error bars corresponding to two standard deviations when assuming a normal distribution with standard deviation (c) sQ = 2 pm and (d) sQ = 4 pm for the distortions of the molecular structure. All error bars are obtained using the non-linear surrogate model based on a 3rd order Taylor expansion for the one-mode contributions and neglecting two-mode and higher-order contributions.

Fig. 5