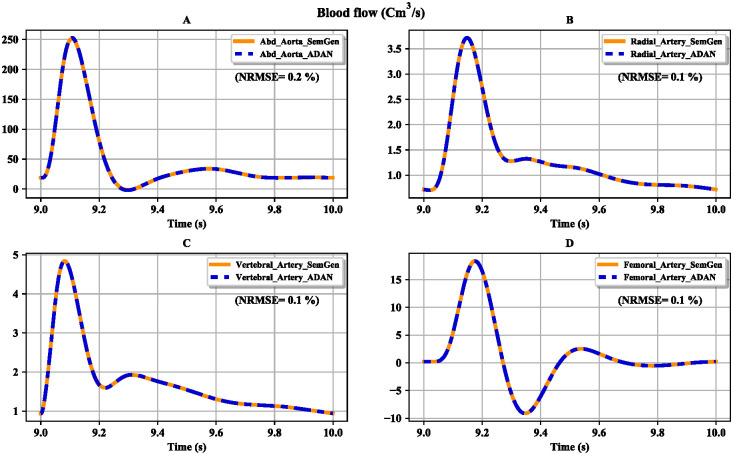
Fig 11. Comparison between the flows obtained from the ADAN open-loop model and our version of the model.
(A) Flow in the abdominal aorta; (B) flow in the radial artery; (C) flow in the vertebral artery; (D) flow in the femoral artery. The normalised root mean square errors (NRMSE) are represented as percentages.

