. 2019 Dec 11;11(5):1269–1275. doi: 10.1039/c9sc03191j

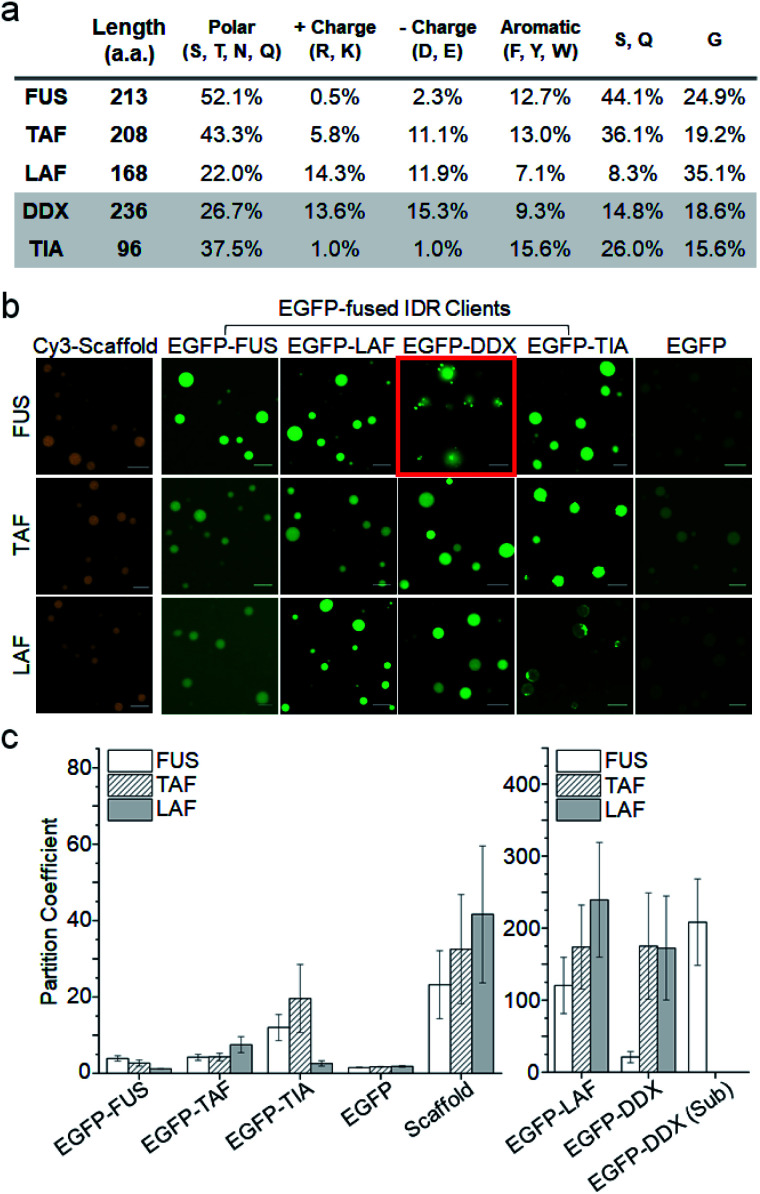
Fig. 2. Recruitment of client IDRs into IDR droplets. (a) Amino acid compositions of IDRs. Polar charged, aromatic, and IDR abundant (S, Q, and G) residues are summarized. (b) Representative fluorescence images of three IDR droplets (FUS, TAF, and LAF) with various EGFP-fused client IDRs and free EGFP (green). Cy3-tagged scaffold IDRs (orange) were used to measure scaffold IDR enrichment inside droplets. The image of EGFP-DDX subcompartments in FUS droplets is indicated with a red box. Scale bars: 10 μm. (c) Partition coefficients (PCs) (inside/outside droplets) of client EGFP-IDRs, free EGFP, and Cy3-scaffolds. The PC of EGFP-DDX sub-compartments inside FUS droplets (EGFP-DDX (Sub)) is also shown. Error bars: 1 s.d. (n = 100 from three independent experiments).

Fig. 2