. 2019 Dec 11;11(5):1269–1275. doi: 10.1039/c9sc03191j

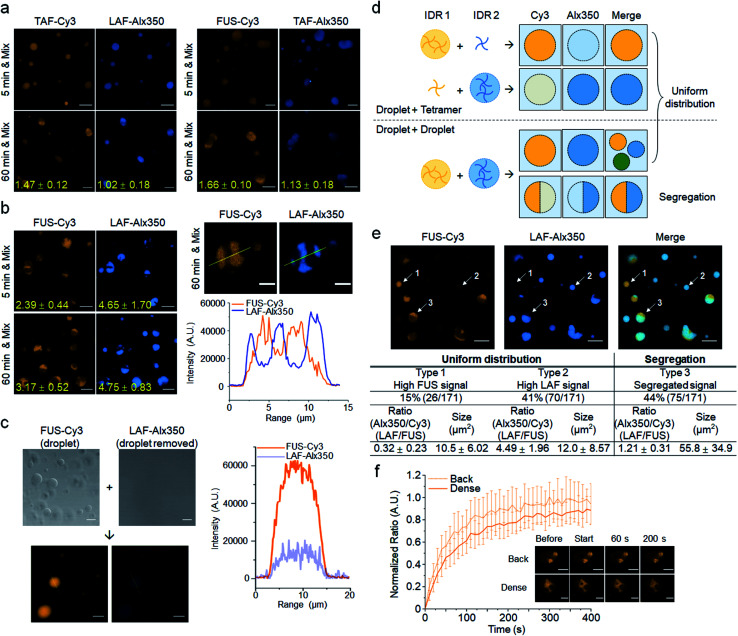
Fig. 4. Dynamic fusion between different droplets after maturation. (a) Fluorescence images of two differently labeled mixed IDR droplets. TAF droplets were mixed with LAF (left) or FUS (right) droplets after 5 min or 1 h maturation and incubated for 5 min. Ratios of fluorescence mean intensities of the dense and diluted phases of segregated droplets are indicated with yellow numbers. Scale bars: 10 μm. (b) Fusion between LAF and FUS droplets. Fluorescence images and intensity profiles of LAF/FUS fused multiphase droplets are shown (right). The fluorescence profiles are obtained using the yellow lines that cross through multiphase droplets. Scale bars: 10 μm (left) and 5 μm (right). (c) Fusion between FUS droplets and the droplet-removed free LAF tetramer. Contrast images of FUS droplets and LAF tetramers before mixing are also shown. Scale bars: 10 μm. (d) Schematic diagram of the mixing processes between two differently labeled IDR droplet solutions. Possible fluorescence images for Cy3 (yellow) and Alx350 (blue) dyes and merged images are depicted. (e) Analysis of a FUS and LAF droplet mixture. Droplets were matured for 1 h before mixing. Representative droplets of uniformly distributed droplets with high FUS (type 1) or high LAF (type 2) and segregated droplets (type 3) are indicated with arrows and numbers. Population, relative IDR ratios, and sizes of these three types of droplets are summarized below (n = 171 from 5 independent experiments). Scale bars: 10 μm. (f) FRAP recovery curves and images of the dense and diluted phases of LAF/FUS fused droplets. Error bars: 1 s.d. (n = 15 from three independent experiments). Scale bars: 5 μm.

Fig. 4