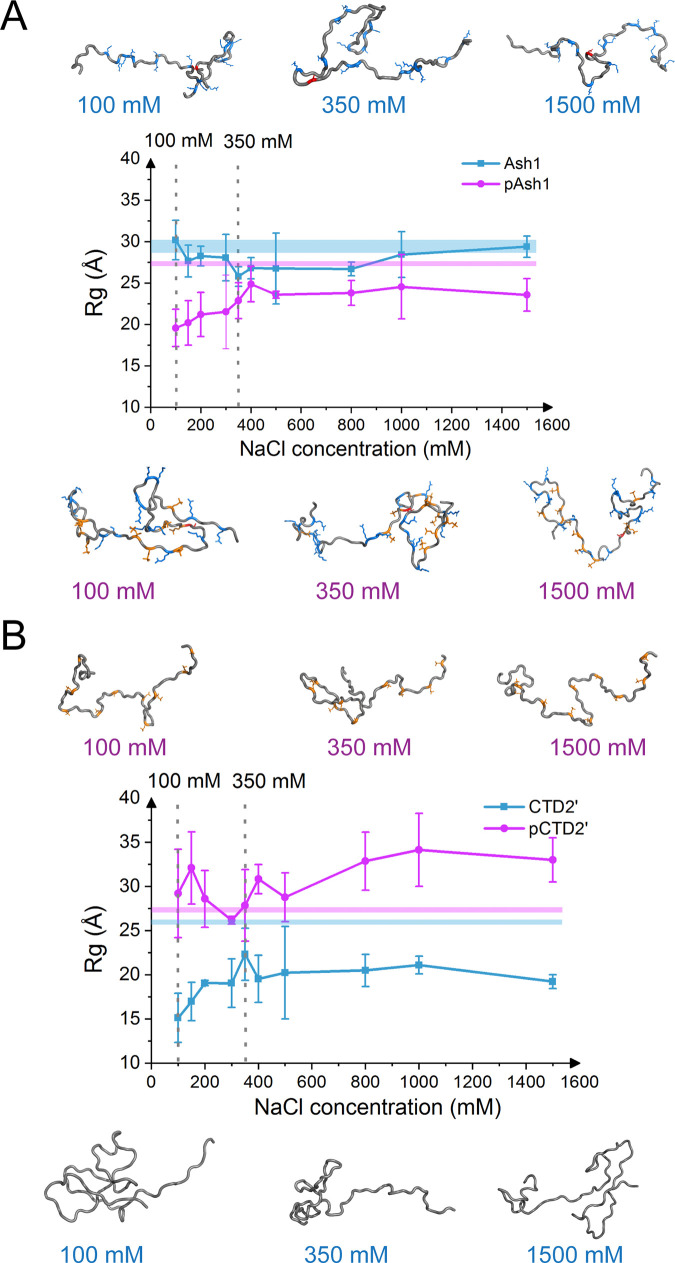
Fig 2. Higher ion strength attenuates phosphorylation-induced shrinkage of Ash1 and expansion of CTD2’.
Global conformation changes, measured by Rg, the mass-weighted radius of gyration, of Ash1 (top) and CTD2’ (bottom) for unphosphorylated (cyan) and multi-sites phosphorylated (purple) forms under different salt concentrations. Experimental values with standard deviations are shown by horizontal lines. Results for 100 mM and 350 mM are emphasized by dashed vertical lines. Representative conformations of MD simulations under 100, 350 and 1500 mM are shown as cartoon. The phosphorylated residues are colored in orange, while the positively/negatively charged residues are colored in blue/red, respectively.

