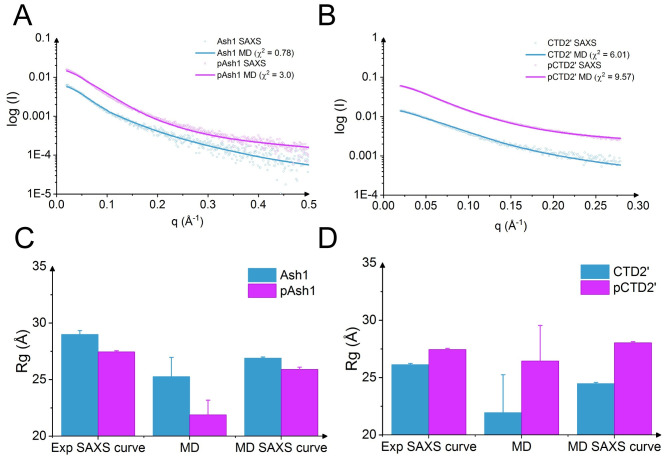
Fig 4. Validation of MD simulations by comparison to SAXS data.
Reversely calculated SAXS curves for Ash1/pAsh1 (A) and CTD2’/pCTD2’ (B) obtained at 350 mM NaCl were compared with experimental curves (150 mM NaCl). The radius of gyration from SAXS experiments using extended Guinier analysis (‘Experimental SAXS curve’), directly calculated from MD simulations (‘MD’), and calculated from MD-based SAXS data using Guinier analysis (‘MD SAXS curve’) were compared for Ash1/pAsh1 (C) and CTD2’/pCTD2’ (D).

