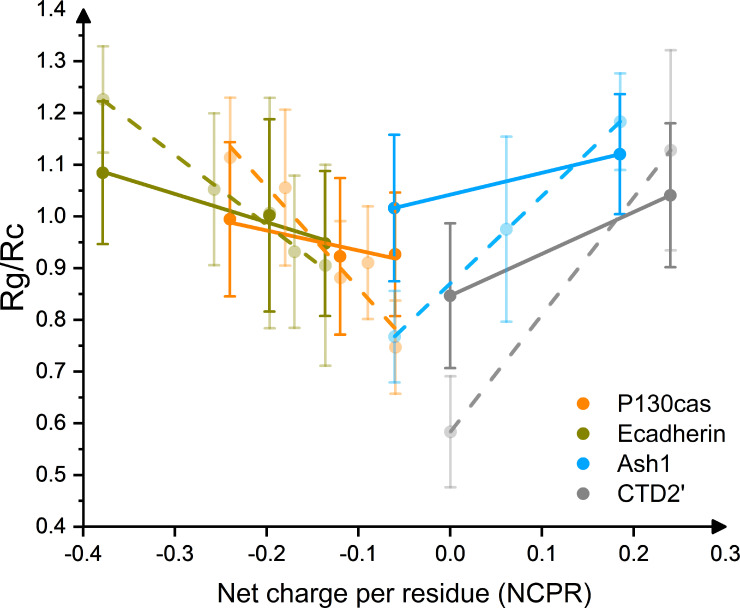
Fig 5. Correlation of Net charge per residue with radius of gyration, normalized to random coil dimension (Rc = R0 × N0.588 [35], where R0 is a constant and N is number of residues of IDP) for Ash1/pAsh1 (light blue), CTD2’/pCTD2’ (gray), E-Cadherin/pE-Cadherin (dark yellow) and p130Cas/pp130Cas (orange), respectively, under 350 mM (solid) and 100 mM (transparent) NaCl.
Linear fittings are shown in solid (350 mM NaCl) and dashed (100 mM NaCl) line. The CTD2’/pCTD2’ states are shown in mirror for clarity.

