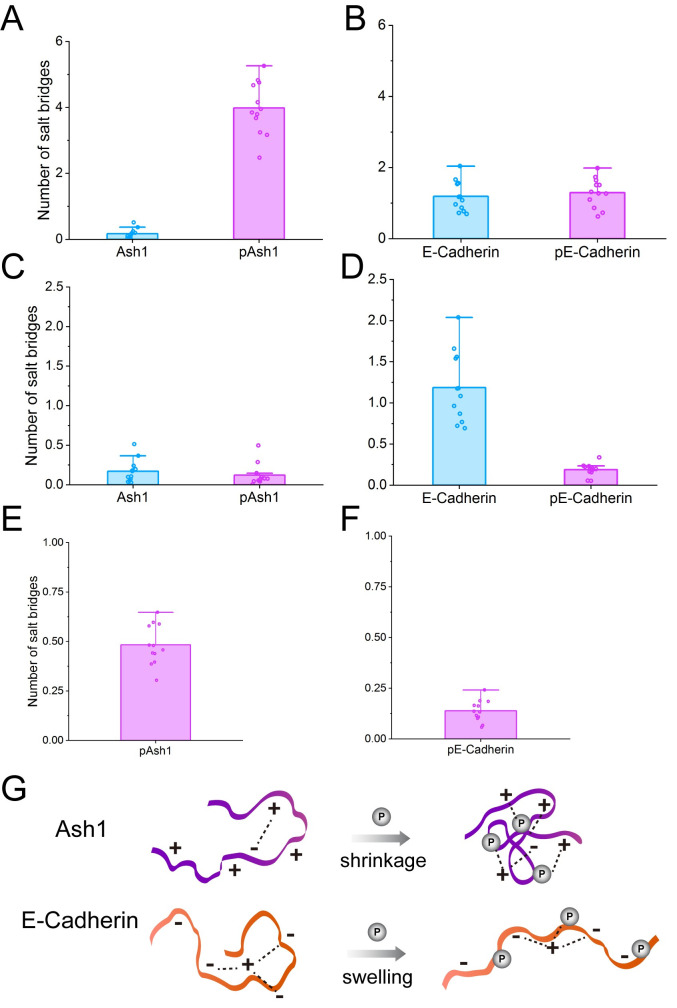
Fig 6. Analysis of salt bridges.
The influence of phosphorylation on the average number of salt bridges in Ash1 and E-Cadherin (A and B) during MD simulations in 350 mM NaCl. The influence of phosphorylation on the only E/D–R/K salt bridges is shown in C and D and the average salt bridges per phosphorylated residue are shown in E and F. Schematic view of how phosphorylation affects the salt bridges (dashed line) in Ash1 and E-Cadherin upon phosphorylation (G).

