. 2020 Jan 10;11(7):1750–1760. doi: 10.1039/c9sc05623h

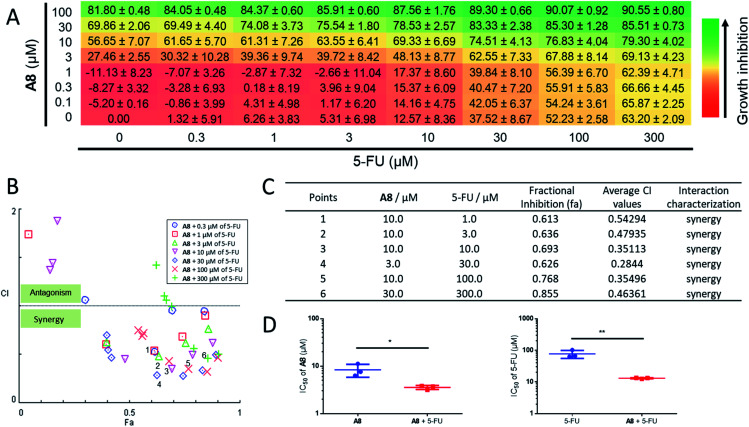
Fig. 5. Combination assay for A8 and 5-FU. RM-1 cells were treated with combinations of A8 and 5-FU for 48 h and growth inhibition was determined using the MTT assay. (A) Checkerboard data showing viability of RM-1 cells with varying A8 (0–100 μM) and 5-FU (0–300 μM) concentrations as a percentage of untreated cells. Data are expressed as means ± SD (n = 3). (B and C) Combination effect analysis for A8 and 5-FU. Combination index (CI, measure of drug synergy) was determined using the Chou-Talalay method. CI values of <1 indicate drug synergy. (D) The concentration needed to reach 50% inhibition (IC50) of cell proliferation is indicated. The left histograms indicate the IC50 of A8 as a single agent and in combination with 5-FU in the RM-1 cell line. The right histograms indicate the IC50 of 5-FU as a single agent and in combination with A8. The IC50 values for the combination of the two compounds were determined using rays with an effective fraction ∼0.5, corresponding to compounds that are in equipotent proportion (A8 : 5-FU, 1 : 3) in the mixture. Error bars represent the standard deviations of the results obtained from three independent experiments. P values were calculated using a two-sided t-test. *P < 0.05, **P < 0.01 UDGI or 5-FU vs. UDG + 5-FU group, respectively.

Fig. 5