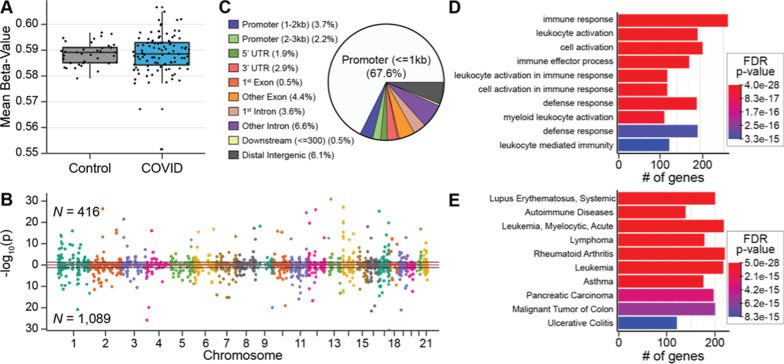
Fig. 2.
Differential SARS-CoV-2 DNA methylation between blood samples from patients on hospital admission for COVID-19 compared to blood samples from healthy controls before the COVID-19 pandemic. A A box and whisker plot depicts the difference in mean global methylation level (y-axis) between COVID-19 patients and healthy controls (x-axis). Each black dot represents the mean methylation level of each participant. These results indicate that global mean methylation levels do not distinguish COVID-19 patients from healthy pre-pandemic controls. B A Manhattan plot of DNA methylation regions shows the distribution of SARS-CoV-2-associated significantly differentially methylated regions (DMRs) across the genome by chromosome number. Hyper-methylated regions are displayed with a positive log10 (p value), and hypo-methylated regions are displayed with a negative log10 (p value). DMRs were ascertained as regions having at least 5 consecutive CpGs where > 75% of the CpGs in the region had an FDR p value < 0.05, and all were either hyper-methylated or hypo-methylated. This approach identified 1505 DMRs, that are displayed above and below the blue lines. Dots alternate colors to depict a change in chromosome. Sex chromosomes were excluded from analysis. These results indicate that 1505 DNA regions are differentially methylated within days of SARS-CoV-2 infection. C A pie chart showing the percent distribution of DMRs to standard genomic features. 5′UTR = 5′ untranslated region 3′UTR = 3′ untranslated region. In keeping with the known role of DNA methylation in regulation of gene expression, a preponderance of DMRs are in gene promoter regions. D Bar graphs of the top ten gene ontological (GO) biological processes related to the COVID-19 differentially methylated genes, ordered by statistical significance. The X-axis indicates the number of COVID-19 DMR-associated genes that contribute to each GO term. Bar color indicates the FDR P-value using a Fischer test. These results indicate that the observed DMRs occur in genes that participate in leukocyte activation and immune responses. E Bar Graph of the top 10 disease ontological (DO) processes related to the COVID-19-associated differentially methylated genes, ordered by statistical significance. The X-axis indicates the number of COVID-19 DMR-associated genes contributing to each GO term. Bar color indicates the FDR P-value using a Fischer test. These results indicate that the observed DMRs occur in genes that participate in the pathogenesis of inflammatory and leukocyte disorders

