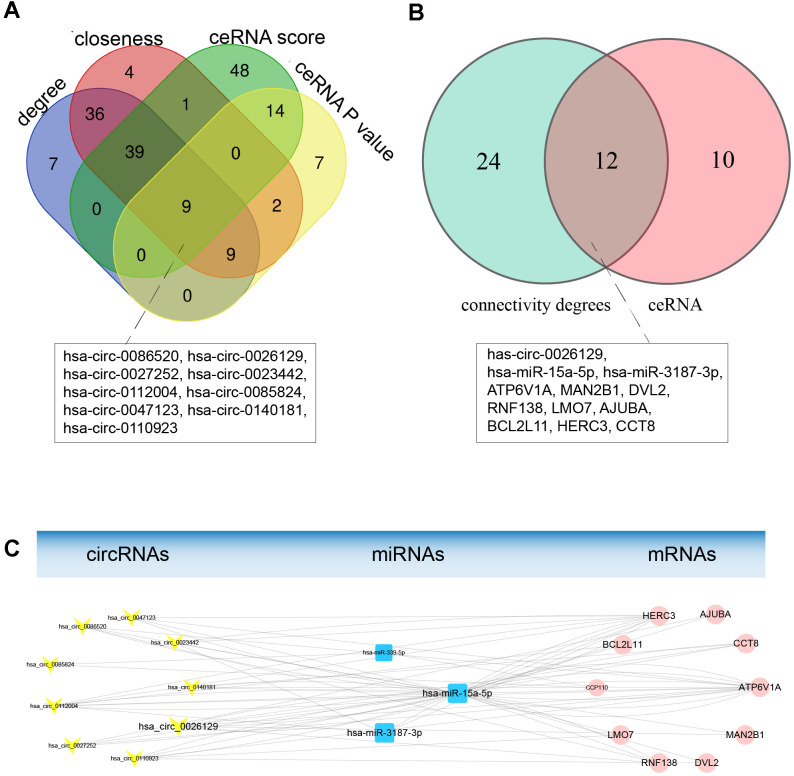
Figure 5.
Topological analysis and construction of the hub ceRNA sub-network. (A) Topological characteristics of the ceRNA netwok. Nine hub circRNAs overlapped among the lists of genes with ceRNA scores > 0.7, genes with ceRNA P-values < 0.01 and the top 100 genes based on the degree of connectivity and betweenness. (B) Venn diagram of overlapping genes between the hub ceRNA network of nine circRNAs and the genes with higher degrees of connectivity. (C) The hub ceRNA sub-network containing the nine hub circRNAs. Yellow V-shaped nodes represent DECs, red rectangular nodes represent DEMis, and blue circular nodes represent DEMs. The larger nodes represent the overlapping hub genes.

