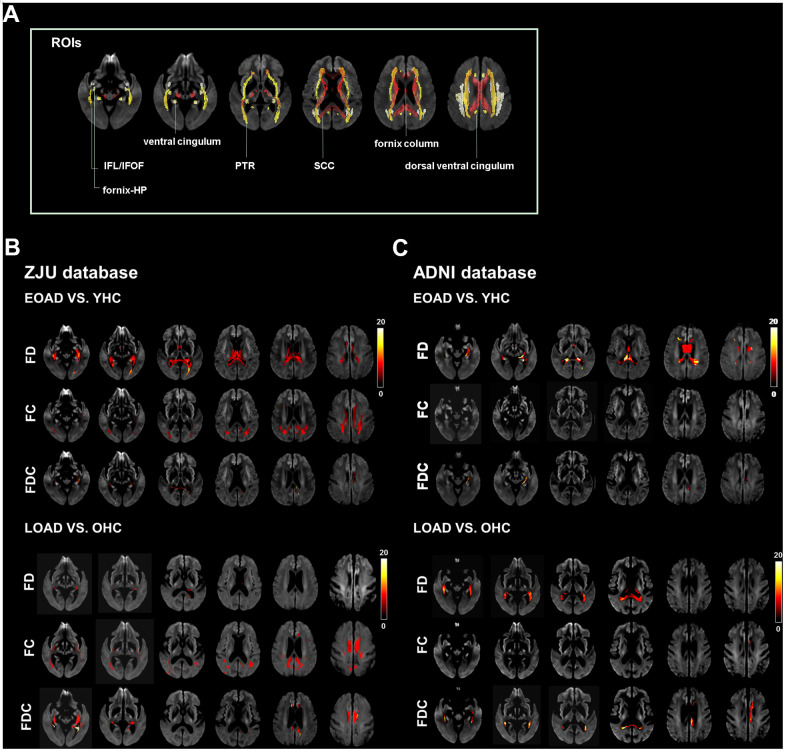
Figure 1.
Illustrates the location reference and fiber tract-specific reduction in EOAD/LOAD versus controls from whole-brain fixel-based analysis. (A) illustrates the location reference. (B) and (C) Represent results from ZJU and ADNI databases, respectively. We color-coded the significant streamlines by the effect size expressed as a percentage relative to the control groups. Abbreviations: ZJU, Zhejiang University; FD, fiber density; FC, fiber bundle cross-section; FDC, fiber density and bundle cross-section.

