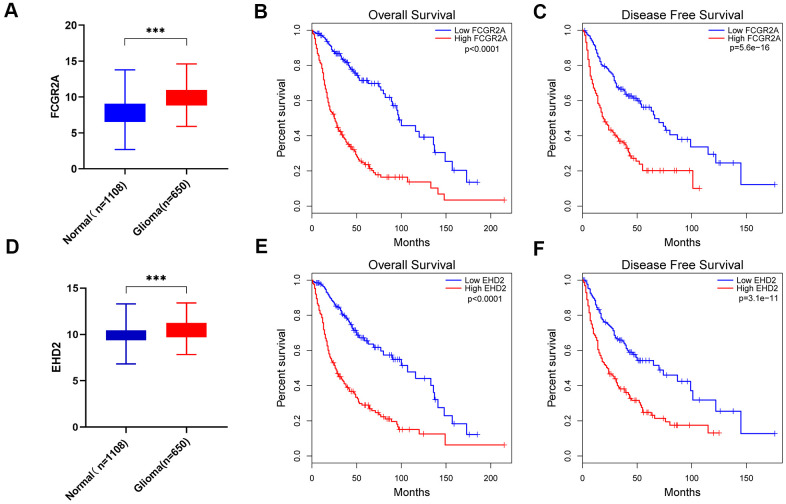
Figure 6.
FCGR2A and EHD2 were selected from the six MES-related genes. (A) Differences in FCGR2A expression between the normal group and the glioma group from the TCGA and GTEx data sets. (B, C) Overall survival analysis (B) and disease-free survival analysis (C) of the relationship between FCGR2A expression level and survival time from the TCGA database. (D) Differences in EHD2 expression between the normal group and the glioma group from the TCGA and GTEX data sets. (E, F) Overall survival analysis (E) and disease-free survival analysis (F) of the relationship between EHD2 expression level and survival time from TCGA database. ***P<0.001.

