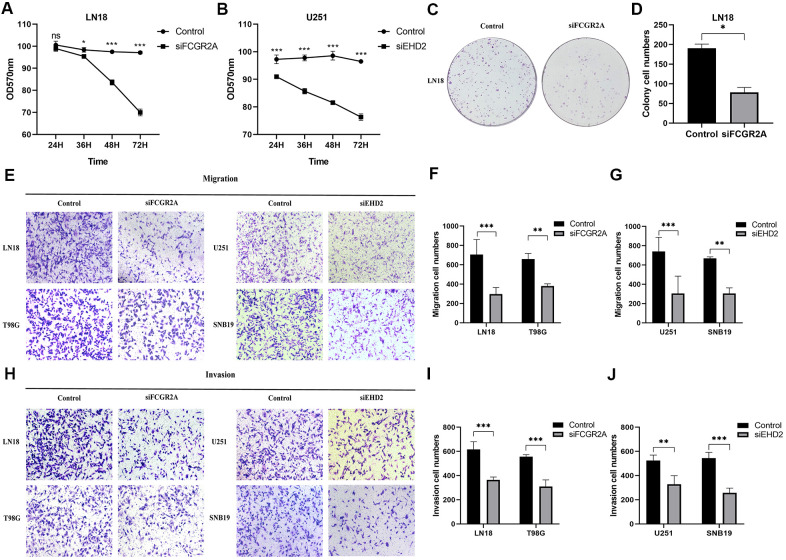
Figure 8.
The effect of glioma cell clone, proliferation, migration and invasion ability after silencing FCGR2A or EHD2. (A, B) Cell proliferation was measured by the MTT assay for 24 hours up to 72 hours. (C, D) Representative imaging (C) or counting (D) of the colonies formed by LN18 cells after silencing with FCGR2A for 7 days. (E–G) Representative imaging (E) or counting (F, G) of migration assays after silencing FCGR2A and EHD2 in glioma cells. (H–J) Representative imaging (H) or counting (I, J) of invasion assays after silencing FCGR2A and EHD2 in glioma cells. *P<0.05; **P<0.01; ***P<0.001.

