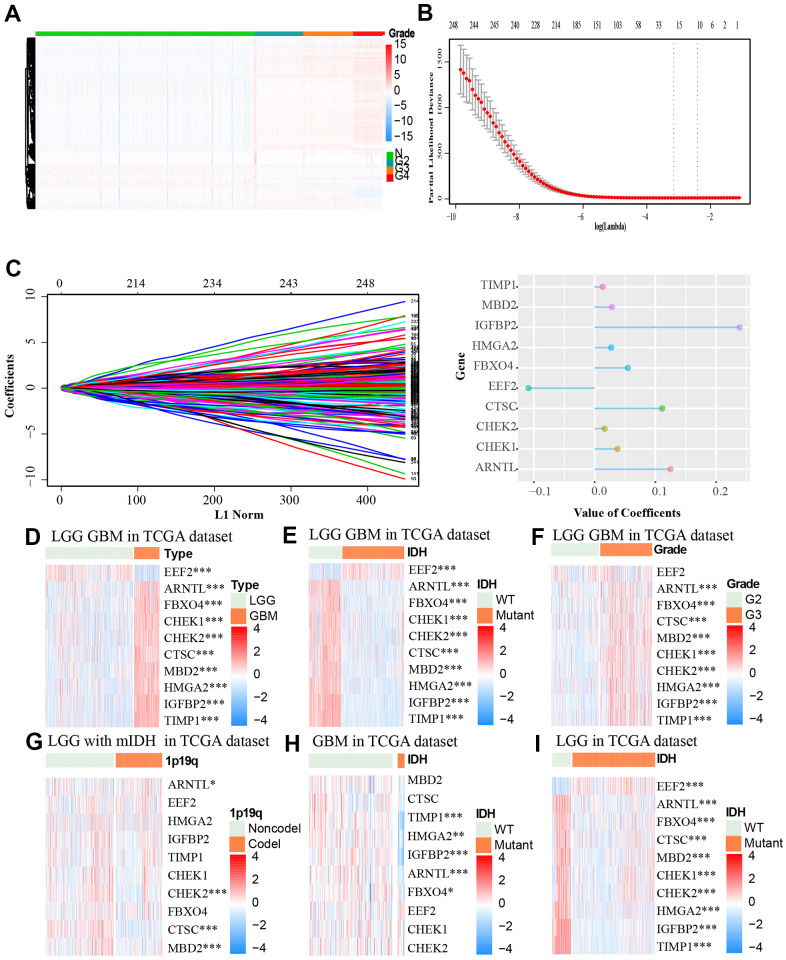
Figure 2.
(A) The association between the expression level of aging-related genes and grade of tumor based on the TCGA dataset was showed by heat map. (B, C) LASSO coefficients of the aging-related genes for OS were calculated. The genes with the 10 highest scores are shown. (D–I) The heat maps, based on the TCGA database, showed downregulated mRNA (blue) or upregulated mRNA (red) of the ten aging-related genes in the subgroups.* p < 0.05, *** p < 0.001.

