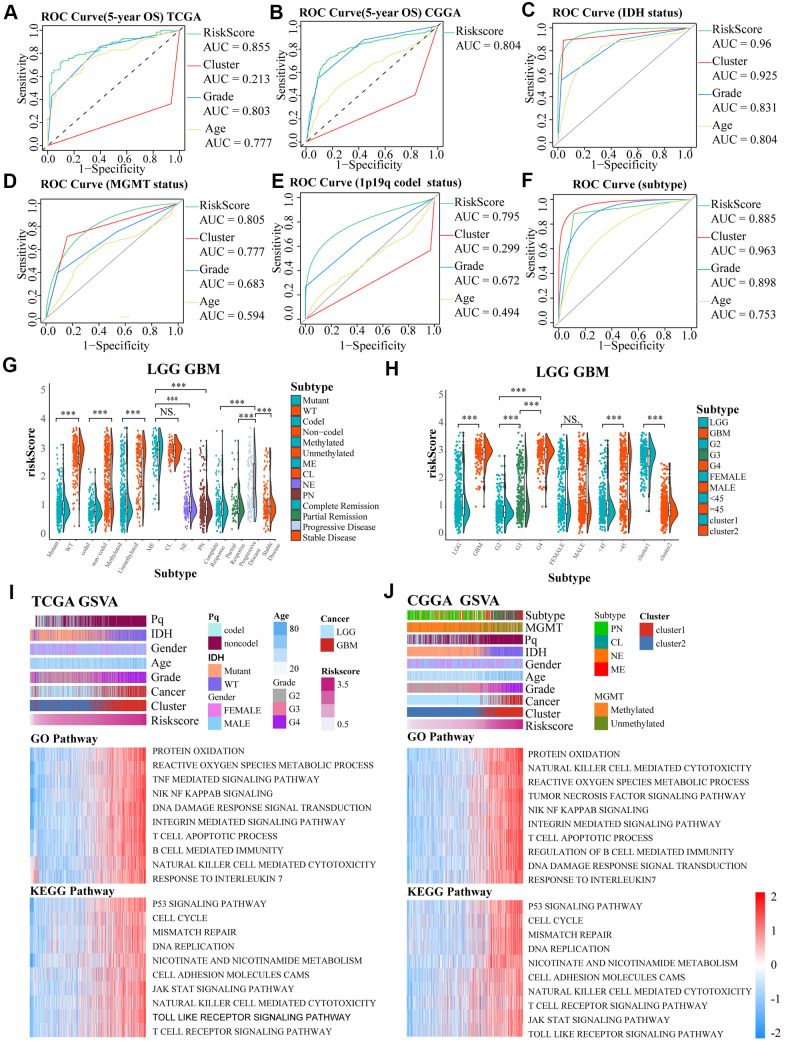
Figure 4.
(A–F) ROC curves exhibited the predictive effect of the four indicators on the clinical characteristics including 5-year OS, IDH status, MGMT status, 1p19q codel status and subtype of glioma cases. (G, H) The differences in risk scores between subgroups classified by IDH wildtype, 1p19q noncodel, MGMT promoter unmethylated, subtype, GBM groups, higher grades, age, and cluster of LGG and GBM patients based on the TCGA dataset. (I, J) GO and KEGG analyses for the risk scores using GSVA. The gene set enrichment of several pathways (lower two panels), and distribution of clinical features, clusters, and risk scores (upper panel) were exhibited by the heat map based on TCGA and CGGA. NS. p > 0.05, *** p < 0.001.

