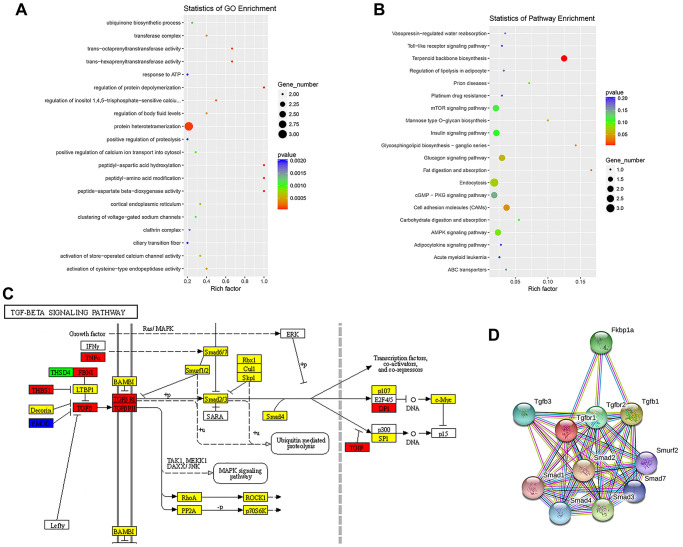
Figure 3.
Enrichment analysis of biological functions and pathways. (A) Top 20 significantly enriched GO terms for differentially expressed ncRNAs are shown in a scatterplot. (B) Top 20 significantly enriched KEGG pathways for differentially expressed ncRNAs are shown in a scatterplot. (C) Mapping of the TGF-β/Smad pathway activated by SCI. In the map, genes encoding pathway proteins were significantly upregulated (red), upregulated without a significant difference (yellow), significantly downregulated (blue), or downregulated without a significant difference (green). (D) PPI analysis of TGF-β/Smad pathway-related proteins.

