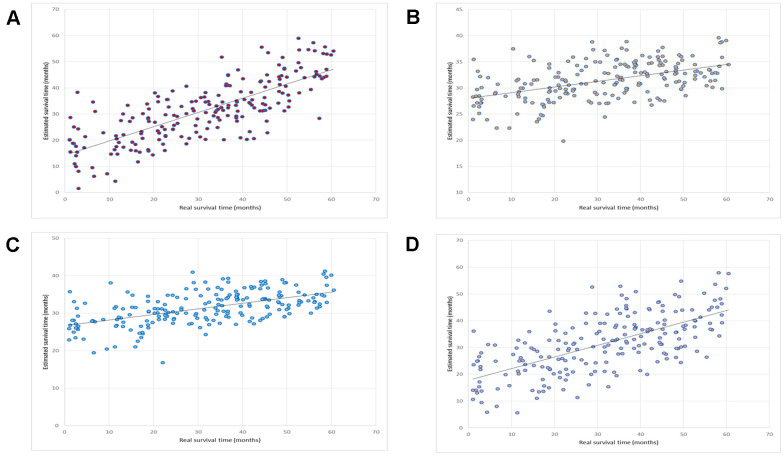
Figure 2.
Prediction of the performance of OV-SURV. (A) OV-SURV achieved a correlation coefficient of 0.76. (B) LASSO yielded a correlation coefficient of 0.48. Real survival time in months is shown on the X-axis, and estimated survival time in months is shown on the Y-axis. (C) Elastic net obtained a correlation coefficient of 0.55. (D) Multiple linear regression obtained a correlation coefficient of 0.66. Real survival time in months is shown on the X-axis, and estimated survival time in months is shown on the Y-axis.

