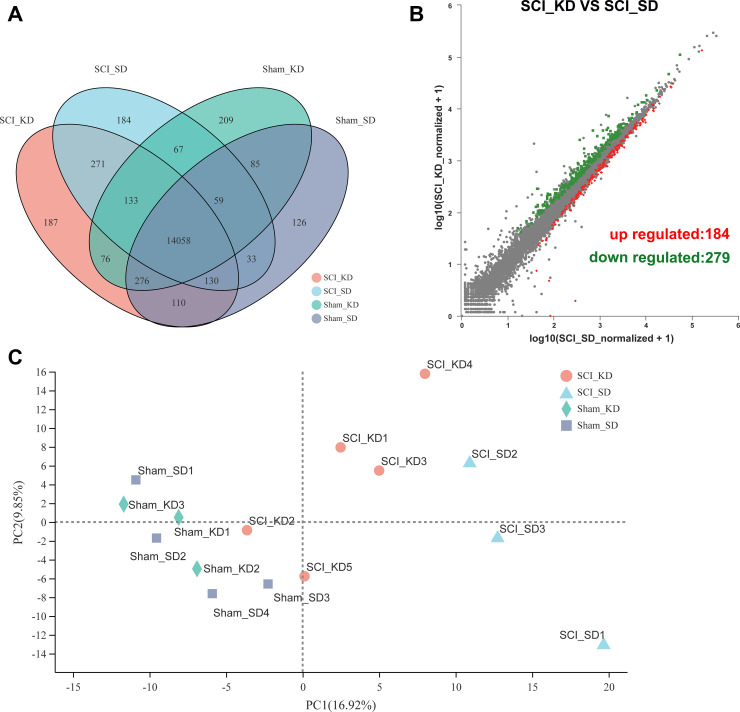
Figure 2.
Changes in mRNA expression profiles between groups. (A) The mRNA expression of the four groups in the entire transcriptome. (B) Volcano plots showing the up- and downregulated mRNA transcripts in the SCI_KD vs. the SCI_SD group. (C) Principal component analysis (PCA) score plot with the two principal components (PC1 = 16.92%; PC2 = 9.85%).

