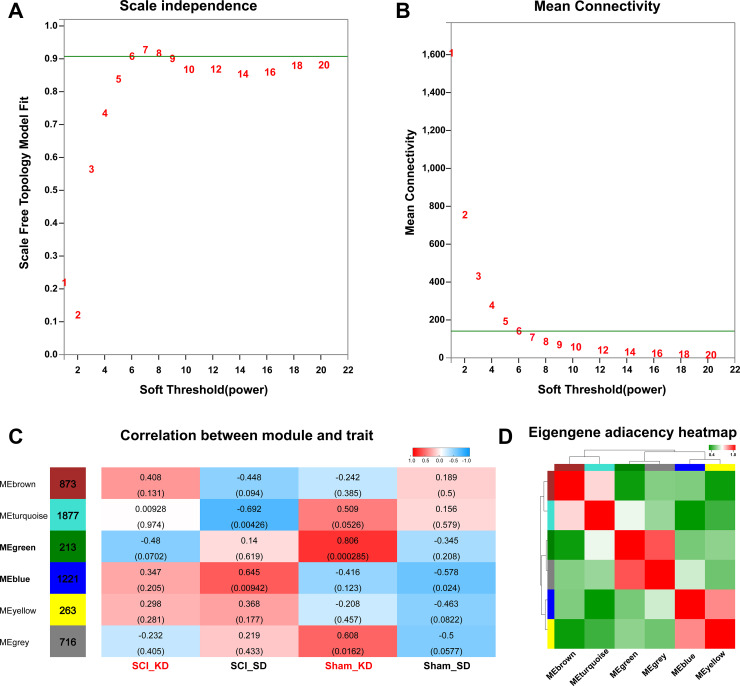
Figure 4.
Data pre-processing and module identification for WGCNA analysis. (A–B) Analysis of the network topology with different soft threshold powers. The left panel shows the influence of soft threshold power on the scale-free topology fitting index. The right panel shows the influence of soft threshold power on the average connectivity. (C) Analysis of the correlation between the module and the diet phenotype. Red indicates that the module has a higher correlation with the phenotype, while blue means the module has a lower correlation with the phenotype. (D) WGCNA module correlation; the colour indicates the correlation between modules.

