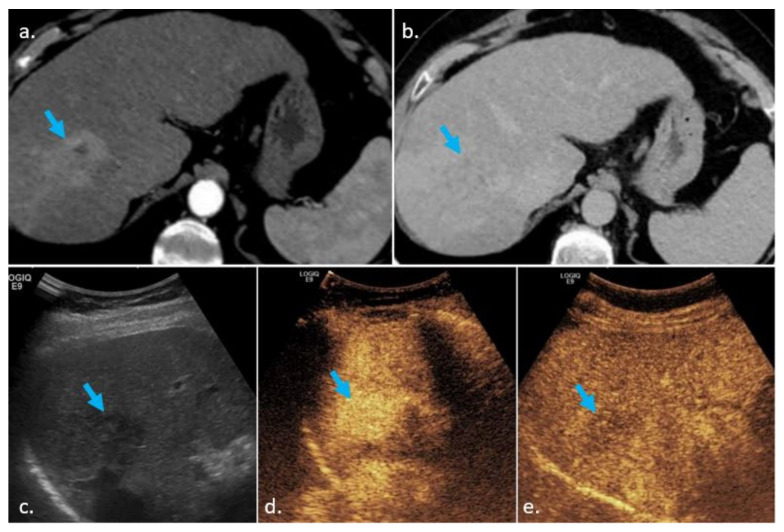
Figure 4.
CT scans of the liver obtained in the arterial (a) and late phases (b). The blue arrow shows a hypervascular nodule (a) with washout (b) localized in segment two of the liver, close to the left portal vein. On CT, the nodule was classified as LI-RADS 5. On US (c), the nodule (blue arrow) was slightly hyperechoic/isoechoic as compared to the surrounding liver parenchyma. On CEUS, the blue arrow shows the same nodule, which presented APHE (d) but did not show any washout (e), therefore, it was classified as LI-RADS 4. This is a rather atypical behavior, as washout is more often seen on CEUS as compared to CT/MRI.

