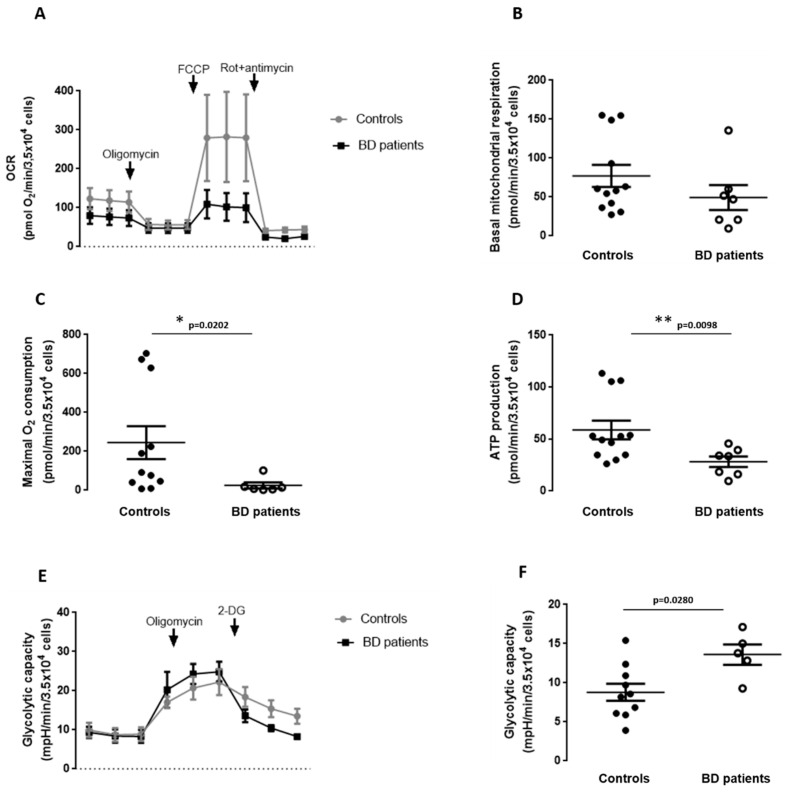
Figure 5.
Mitochondrial respiration and glycolytic capacity in BD patients’ fibroblasts. Oxygen consumption rate (OCR) was evaluated in fibroblasts from BD patients and age-matched controls. (A–F) Mitochondrial respiration was assessed by sequential addition of oligomycin, FCCP and rotenone/antimycin A by using a Seahorse XF24 flux analyzer. (A) Representative traces depicting the average of n = 5 controls and n = 3 BD patients-derived fibroblasts. (B) Basal mitochondrial respiration, (C) maximal O2 consumption and (D) ATP production values result from the subtraction of each parameter with the first value of OCR after rotenone+antimycin injection. Data are the mean ± SEM expressed in absolute values of five different control individuals and three BD patients after the correction with non-mitochondrial OCR provided by the injection of rotenone+antimycin. (E,F) Glycolytic capacity was assessed by sequential addition of oligomycin and 2-deoxyglucose (2-DG). (E) Representative traces and (F) glycolytic capacity. Data are the mean ± SEM expressed in absolute values of five different control individuals and 3 BD patients after the correction with non-glycolytic ECAR provided by the injection of 2-deoxyglucose. Experiments were carried out in duplicate. * p < 0.05; ** p < 0.01, significantly different from control group, as determined by Mann–Whitney non-parametric test.

